eBooks Search Include Read Aloud for titles that can be read aloud.


  Please 

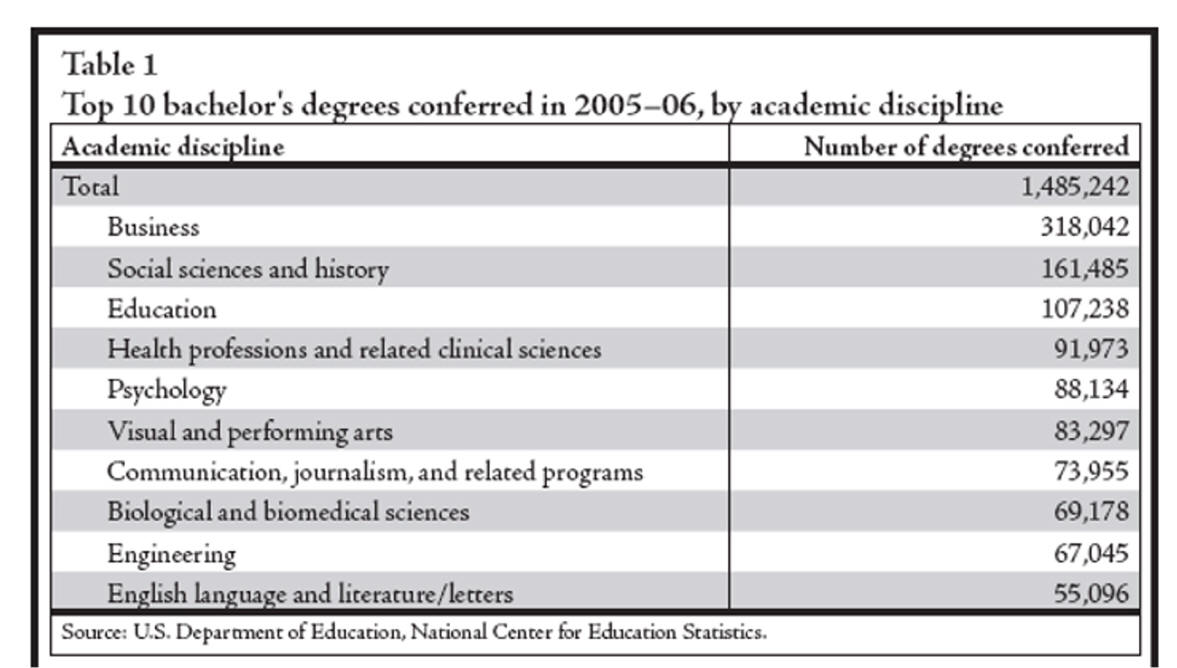
U.S. Produced Almost 1.5 Million
Bachelors Degrees in 2005-2006

Material is from Winter 2008 of Job Outlook
Career Beginnings for Business Majors.

View the full repost at
PDF (510K)
http://www.bls.gov/opub/ooq/2009/winter/
   is the latest update for winter of 09.

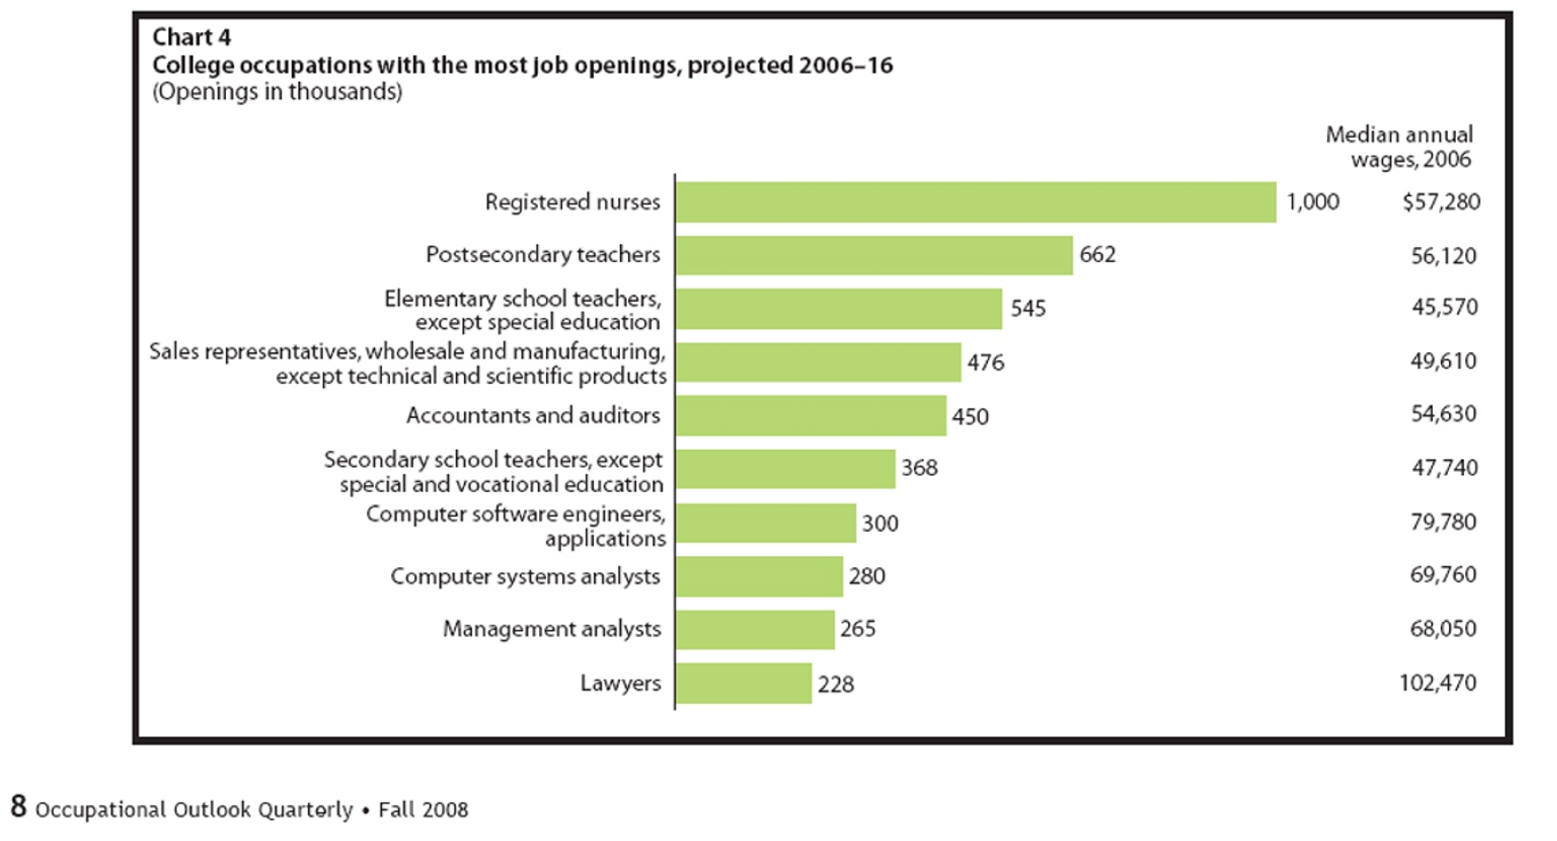
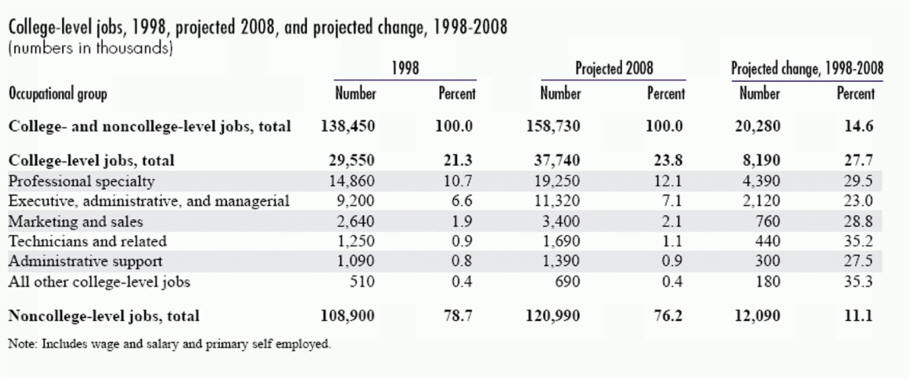
New College Graduate Job Openings
2006-16 to Average 500,000
BLS defines college occupations as those
 where more than 50% have a college degree or higher.

Material is from Job Outlook Fall of 2008,  Job Outlook by Education Occupation 2006-2016
.
View the full report at  PDF (921K)

Will someone please tell the politicians we have too many college graduates and many have an unemployable major!  What we need is an educational system that trains for our children's real future, not some academic ideal 1000 years in the future.

Job Outlook by Occupation 2006-2016
Material is from Job Outlook Fall of 2008,  Job Outlook by Education Occupation 2006-2016
. Download the PDF (921K)

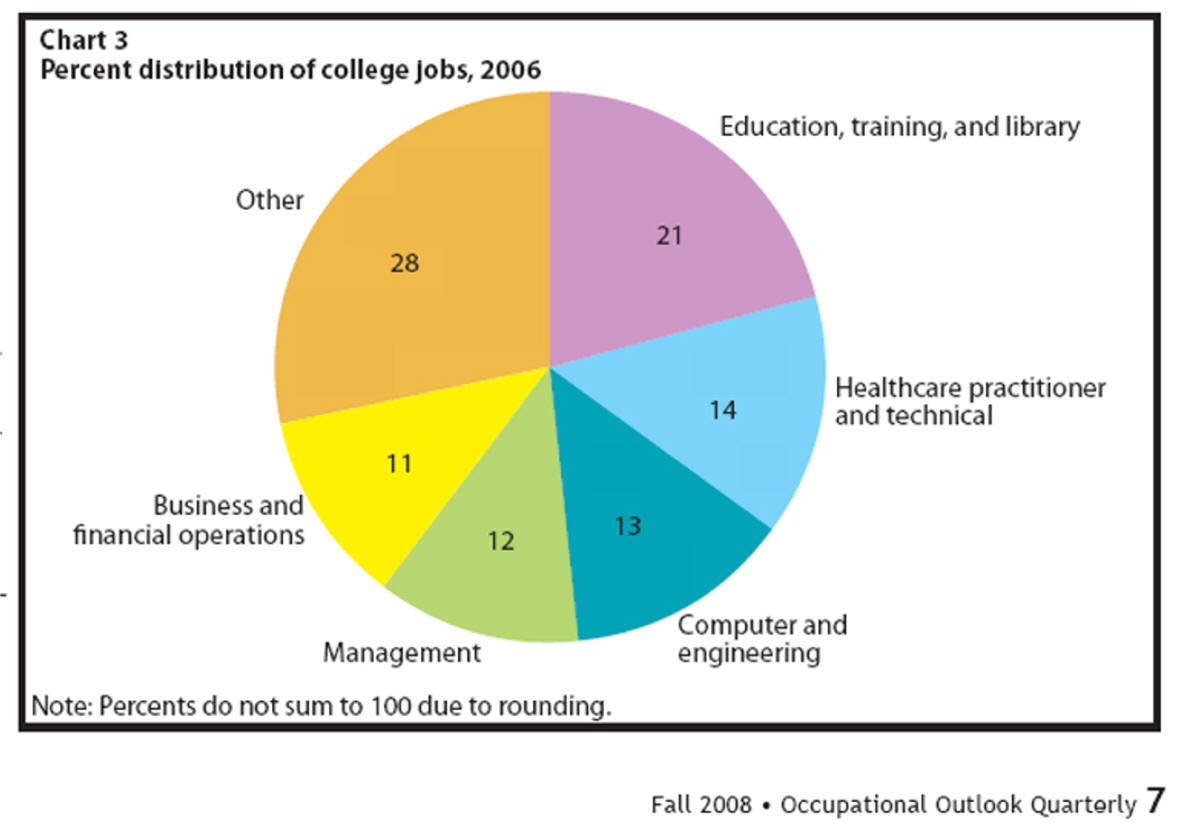
Here Where Most Of The New College Jobs will Be

Industries Hiring College Graduates

New College Graduate Job Openings

Ten Year Total is 4.574 million.
Less Than 500,000 annually
BLS defines college occupations as those
 where more than 50% have a college degree or higher.

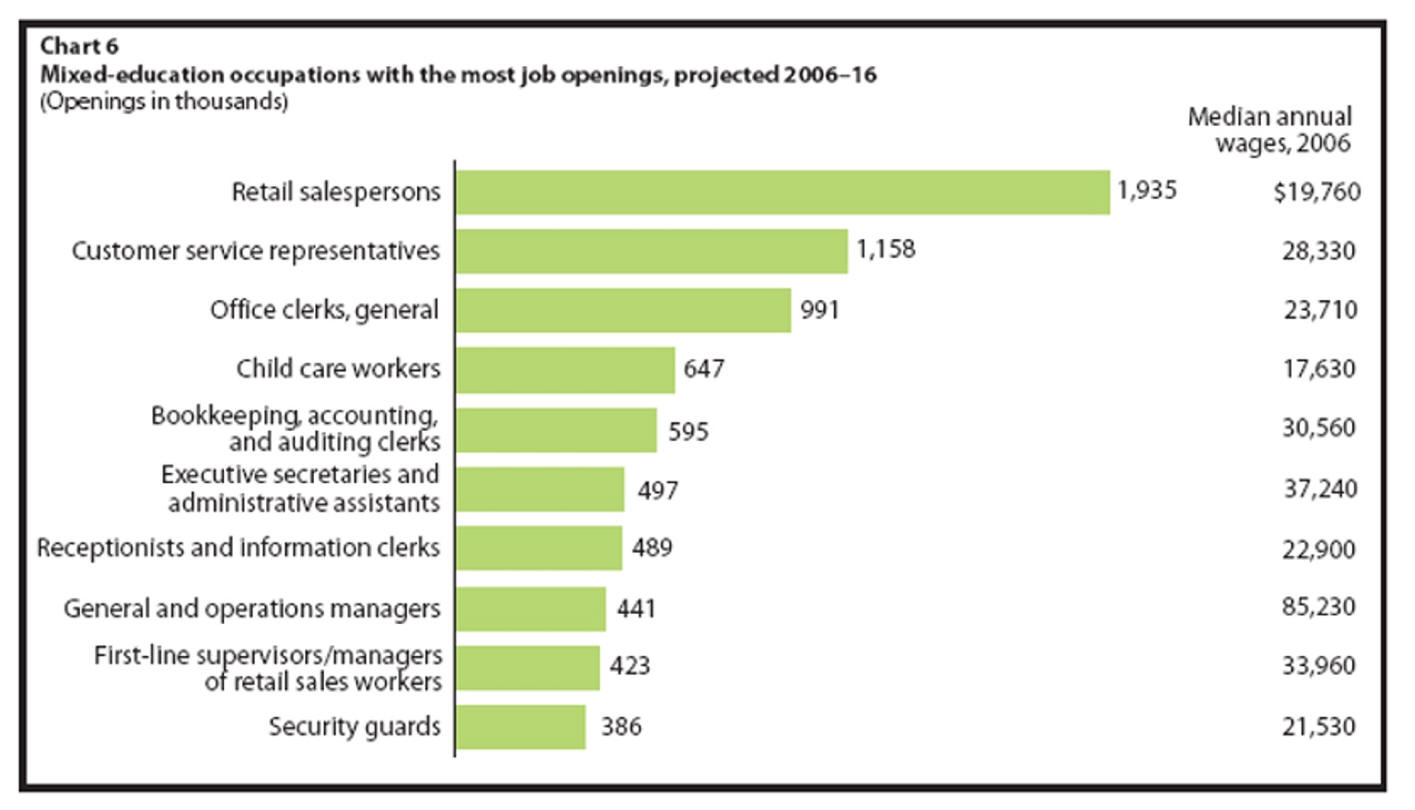
Mixed Education Occupations
Top Ten Chart Total is 7.562 million.
More Than 750,000 annually
BLS defines mixed occupations as those where less than 51%
 have a college degree but more than a high school diploma. 
diploma.

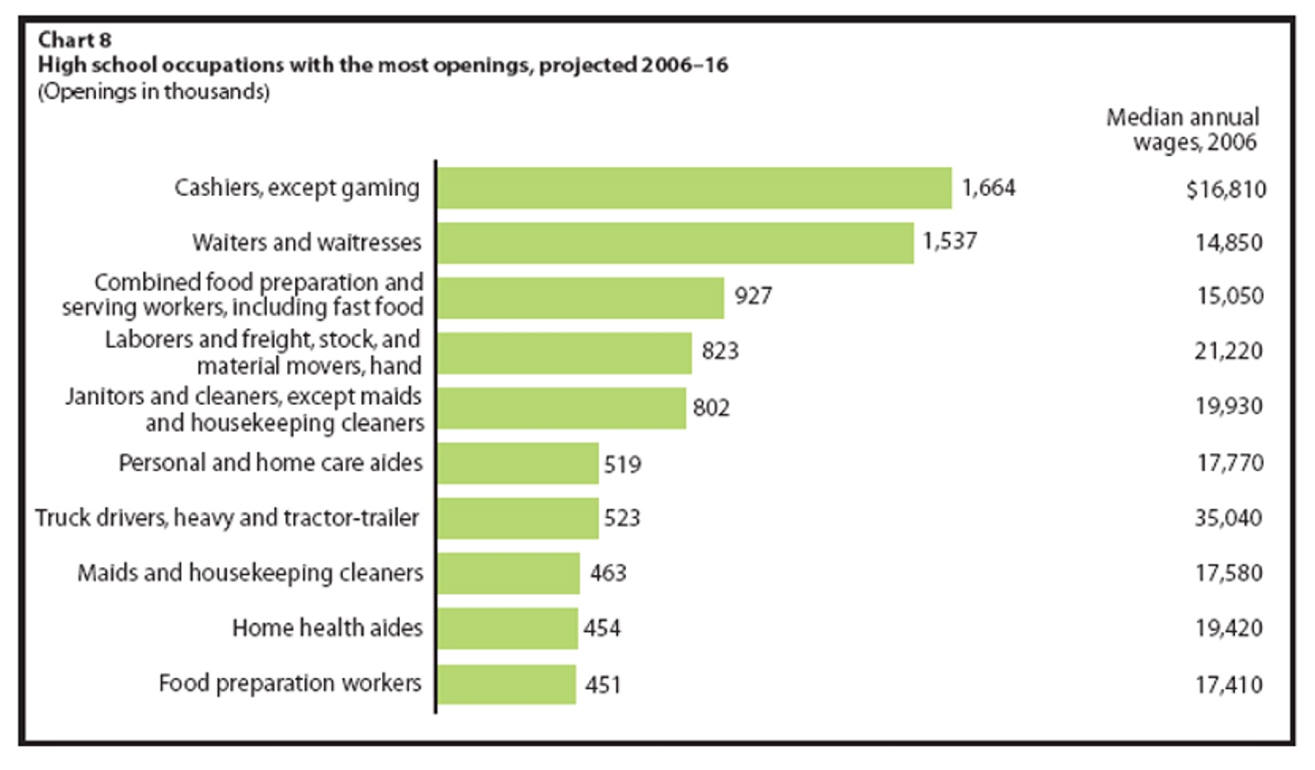
High School  or Less Occupations
Top Ten Chart Total is 8.16.
More Than 800,000 annually


Bureau of Labor Statistics
2004-14
Job outlook
by education

Olivia Crosby and Roger Moncarz


don’t have a bachelor’s degree

Nutshell   Snippet   How to best view PDF files PDF


have a college graduates

Nutshell   Snippet   How to best view PDF files PDF


Occupation Employment Projections to 2014
by
Daniel E. Hecker visit  
Abstract | Excerpt | Full text in PDF (205K)
 

Summary of the Bureau of Labor Statistics 2004-2014 Job Outlook
by Education
for College Graduates

"Between 2004 and 2014, BLS projects 55 million job openings for workers who are entering an occupation for the first time. Of these, at least 13.9 million [25.3%]are expected to be filled by college-educated workers."

It is important to understand their definition of college-educated workers. It is those working in one of two groups of college graduate occupations. In "... 'pure college' occupations', at least 60 percent of current workers aged 25-44 have a bachelor’s or higher degree, fewer than 20 percent have a high school diploma or less education, and fewer than 20 percent have taken college courses but do not have a bachelor’s degree." BLS projects that pure-college occupations will provide about 6.9 million..." [about 12.5% of the total openings].

"Over the 2004-14 decade, about 15.6 million openings are projected to be in occupations in which the number of college educated workers is significant—20 percent or more but which also employ a significant number of workers with other levels of education." Of this "Mixed education" occupations group, the  "...BLS
expects 7 million to be filled by college graduates..." [about 12.5% of the total opening][ note 12.5 +12.5 = 25]

The August 20&27 issue of Business Week states on page 45 that the BLS reports that 34% of adult workers in the U.S. now have a college degree.  If only 12.5% of our jobs require a pure college degree and if another 12.5% require what might be described as significant college, why are so many academically  average students being pushed into algebra at the expense of vocational and career training.

Editor's Note: Of my eight nephews and nieces, four have a college degree and of the the two highest earners, one dropped out of school a week into the ninth grade and earned a GED and the other graduated from the carpentry department of his high school.

Projected Employment Growth 2006-2016


Employment Growth 2006-16 (000)


Education Beyond High School

 
Occupations None Two Years Four Years Six Years > Six Years

2006 Median Salary

Registered nurses  

587


$57,280

Retail Sales 557         $19,760
Customer service representatives 545         $28,330
Food prep and services workers 452         $15,050
Office clerks, general 404         $23,710
Personal and home care 389         $17,770
Home health aids 384         $19,420
Post Secondary teachers         382 $56,120
Janitors, cleaners, except maids and housekeepers 345         $19,930
Nurses aids, orderlies, and attendants 264         $22,180
Bookkeepers, accounting and auditing clerks 264         $30,560
Waiters and waitress 255         $14,850
Child care workers 248         $17,630
Executive secretaries and administrative assistants 239         $37,240
Computer software engineers     226     $79,780
Accountants and auditors     226     $54,630
Landscaping and grounds keeping workers 221         $21,260
Elementary school teaching, except special education     209     $45,570
Receptionists and information clerks 202         $22,900
Truck drivers, heavy and tractor trailer 193         $35,040
Totals 4,962 587 661   382 6,592
Percent of total 75 09 10   06 100
How to best view PDF files Download the PDF (2,530K) and see page 14 of the Employment Outlook Quarterly Vol. 53, #3 the actual data.
Editor's note: While only 16% of the new jobs requiring a bachelor's degree or more may seem low, read on to see why it is quite accurate.


Editors Note: Read on to see how little has changed in the number of obs requiring a college degree.


Editors Note concerning the following Chart.
Ten years have gone by since the Bureau of Labor Statistics 1998-2008 Job Growth Projections analysis which appears below and has been updated here for 2004-2014 data. Little has changed though that projection missed the big drop in computer science jobs. Projections seldom see a big change coming.

Part I 1998-2008 Job Growth Projections

I. Projections are from Occupational employment projections to 2008 and
  The outlook for college graduates, 1998-2008: A balancing Act Chad Fleetwood and Kristina Shelley
A. Written by Douglas Braddock
B.  Published by the United States Department of Labor
C. Table in parenthesis is relevant table number in Occupational employment projections to 2008.
D.  Data arrangements and comments are from 21st Century Learning Products.
II. Key to educational requirements abbreviations used in Tables
A. Short, Medium, and Long-term on-the-job-training is S OJT, M OJT, and L OJT respectively. 
  B. Work experience in a related occupation is EXP
  C. Associates Degree is AD
  D. Bachelor's Degree is BD
  E. Doctoral Degree is DD
  F. Percentage increase  is % Increase

12

Table II Expected Job Growth 1998-2008 by Educational Category

Job Growth Not Requiring 
Education After High School

Job Growth Requiring 
Education After High School

Jobs 
Growth
% of  Total 
Job Growth
Jobs 
Growth
% of  Total 
Job Growth
S OJT( up to 1 month) 7,576,000 37.4% Post-secondary vocational training 643,000 3.5%
M OJT(2-12 months) 1,430,000 7.1% Associates 1,537,000 7.6%
Related experience 1,316,000 6.5% Bachelor's 4,217,000 20.8%
L OJT(over12 months) 1,168,000 5.8% Bachelor's plus work experience 1,680,000 8.3%

First professional degree 308,000 1.5%
Master's degree 174,000 .9%
Doctoral degree 232,000 1.1%
Total 11,490,000 56.7% Total

8,791,000

43.3%1

1Column percentages do not total because of rounding

Editors note: Expected college graduates not working in college graduate jobs in current decade over previous decade is expected to drop from 14% to to 7%.  Real problem, a real shortage in science and math career and because the labor department is expanding jobs requiring a college degree to career such as administrative assistant (secretary), some feel the over supply is mot going down.

Table III Occupations With The Largest Expected Job Growth, 1998-2008
(In Thousands of Jobs)

Rank

Occupation


S
OJT
EXP AD BD DD % Increase Earnings Quartile Rank1
1) Systems Analysts   577   94 1
2) Retail salespersons 563     14 4
3) Cashier 556     17 4
4) General Manager and top Executives 5512   16 1
5) Truck drivers light and heavy 493     17 2
6) Office clerks general 463     15 3
7) Registered nurses     451     22 1
8) Computer support specialists     439     102 2
9) Personal care and home health aids 433 58 4
10) Teacher assistants 375 31 4
Rank

Occupation

S
OJT
EXP AD BD DD % Increase Earnings Quartile Rank1
11) Janitors, cleaners, maids, house cleaners 365 11 4
12) Nursing aids, orderlies, and attendants 325 24 4
13) Computer engineers 323 108 1
14) Teachers, secondary schools 322 23 1
15) Office, administrative support and managers 313 19 2
16) Receptionists and information clerks 305 24 3
17) Waiters and waitresses 303 15 4
18) Guards 294 29 4
19) Marketing and sales workers supervisors 263 10 2
20) Food counter, fountain, and related workers  247 12 4
Rank

Occupation

S
OJT
EXP AD BD DD % Increase Earnings Quartile Rank1
21) Child care workers 236 26 4
22) Labors, landscaping, and grounds keeping 234 21 3
23) Social workers 218 36 2
24) Hand packers and packages 213 22 4
25) Teachers, elementary school 205 12 1
26) Blue-collar worker supervisors 196 9 1
27) College and university faculty 195 23 1
28) Computer programmers 191 30 1
29) Adjustment clerks 163 34 3
30) Correctional officers 1482 34 2

Totals

5568 920 890 1259 195
1Income Hourly Quartile Ranges: Q1 is "very high" at $16.25 and over, Q2 is "high" at $10.89 to $16.24, Q3 is "low" at $7.78 to $10.88, and Q4 is "very low" at up to $7.77.
2Correctional officers require long-term on-the-job training.

Table IV Occupations With The Fastest Expected Job Growth, 1998-2008
(In Thousands of Jobs)

Rank

Occupation

S
OJT
M
OJT
L
OJT
AD BD BD+
EXP
MD or DD % Increase Earnings Quartile Rank1
1) Computer Engineers 323 108 1
2) Computer Support Specialists 439 102 1
3) Systems analysts 577 94 1
4) Database administrators 67 77 1
5) Desktop publishing specialists 19 73 2
6) Paralegal and legal assistant

84

62 2
7) Personal care and home health aides 433 58 4
8) Medical assistant 146 58 3
9) Social and human service assistant  141 53 3
10) Physician assistants 32 48 1
Rank

Occupation

S
OJT
M
OJT
L
OJT
AD BD BD+
EXP
MD or DD % Increase Earnings Quartile Rank1
11) Data processing equipment repair

371

47 2
12) Residential councilors

88

46 3
13) Electronic semiconductor processors 29 45 2
14) Medical record and health information technicians 41 44 3
15) Physical therapy assistants and aids 36 44 3
16) Engineering, natural science, and computer and information systems managers 142 43 1
17) Respiratory therapists 37 43 2
18) Dental assistants 97 42 3
19) Surgical technologists 231 42 2
20) Securities, commodity, and financial services sales agents 124 41 1
Rank

Occupation

S
OJT
M
OJT
L
OJT
AD BD BD+
EXP
MD or DD % Increase Earnings Quartile Rank1
21) Dental hygienists 58 41 1
22) Occupational therapy assistants and aides 7 40 2
23) Cardiovascular technologists and technicians 8 39 2
24) Correctional officers 148 39 2
25) Speech-language pathologists and audiologists 402 38 1
26) Social workers 218 36 2
27) Bill and account collectors 110 35 3
28) Ambulance drivers and attendants, except EMTS 7 35 3
29) Biological scientists 283 35 1
30) Occupational therapists 25 34 1

Totals

550 413 167 770 1454 142 68
Percent of grand total of 3564 15.4% 11.6% 4.7% 21.6% 40.8% 4.0% 1.9%
1 Requires postsecondary vocational training
2 Requires a master's degree
3 Requires doctoral degree

III.

Individual occupations growth data is available.
  A. Table III of Occupational employment projections to 2008 has detailed growth for more than 500 occupations. 
  B. Let the computer do the searching by visiting BLS Occupation Growth Search.
         
IV. Want to learn more about individual occupations growth and expected salaries? 
  A. Read The 1998 - 2008 job outlook in brief by Jonathan W. Kelinson and Patricia Tate
  B. It was published in the Spring 2000 edition of Occupational Outlook Quarterly of the Department of Labor.

About the Author of 1998-2008 Job Growth by Required Education and Occupation