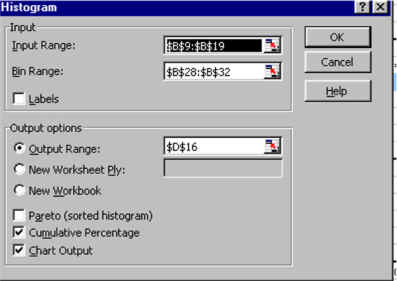
To Make a Histogram
choose Tools and Data Analysis and
double click on Histogram.
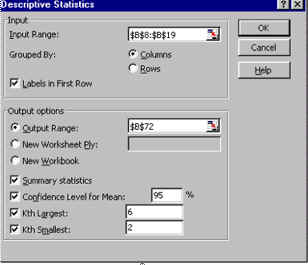
To Calculate Descriptive Statistics
choose Tools, Data Analysis, Descriptive Statistics.
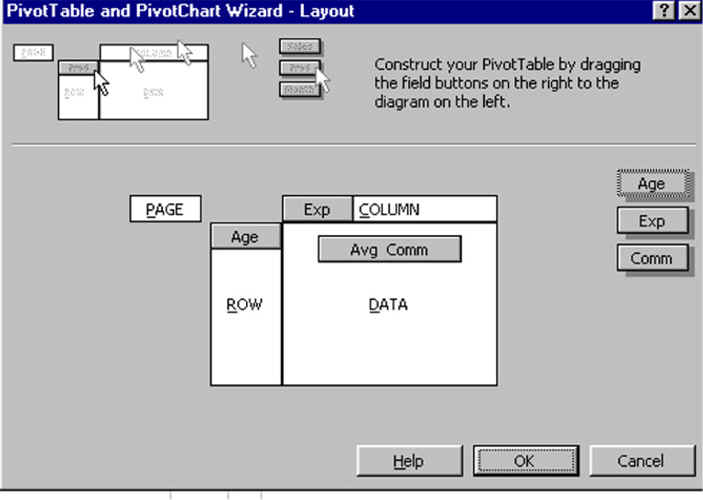
To Make a Pivot Table
choose Data, Pivot Table Report, leave the default, and choose Next twice.
File
5, Question 1
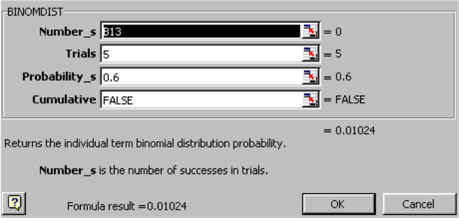
To Calculate a Binomial Distribution
choose , Statistical, BINOMDIST, and OK.
File
5, Question 3
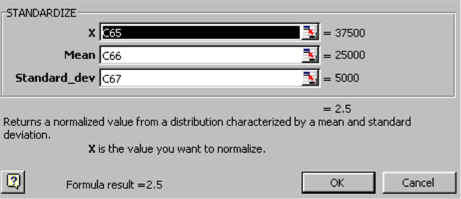
To Calculate the Area Under a Normal Curve
choose fx, Statistical, STANDARDIZE, and OK.
File
5, Question 5
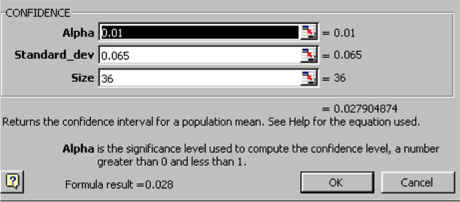
To Find Interval Estimates of the Population Mean Using Sample Statistics
choose fx, Statistical, CONFIDENCE, and OK
File
5, Question 5
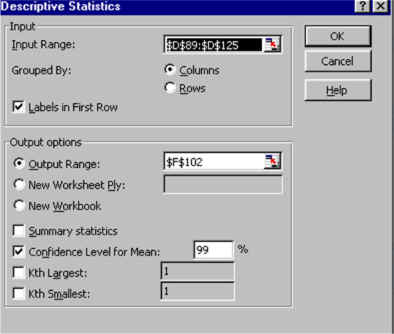
To Find Interval Estimates of the Population Mean Using Actual Sample
Data
choose Tools, Data Analysis, Descriptive Statistics, a
![]() Dialog box contain a
lot of useful information.
Dialog box contain a
lot of useful information. ![]()
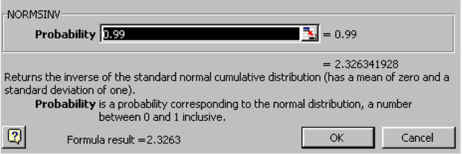
To Calculate the Critical Value for z,
choose fx, NORMSINV, insert .99 into Probability, and choose OK.
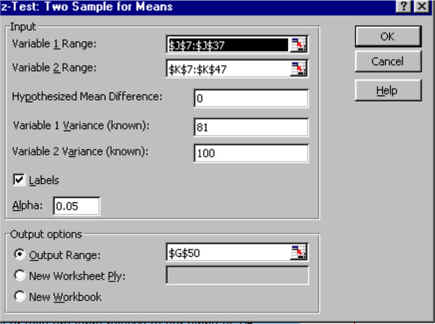
To Conduct a Two-Sample z Test,
choose Tools, Data analysis, z-Test: Two Samples for Mean, and OK.
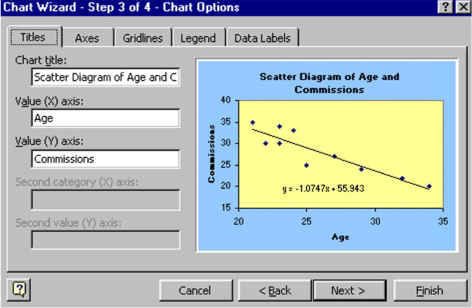
To Graph a Regression Equation
choose the Chart icon Choose the Chart sub-type graph Scatter, Compares pairs of values, Next, and Next.