Not All College Majors Have a High Economic Return
Return to Education Stuff from Around the World
Updated 9/5/22 Please Share
|
Not All College Majors Have a High Economic Return Return to Education Stuff from Around the World Updated 9/5/22 Please Share
|
|
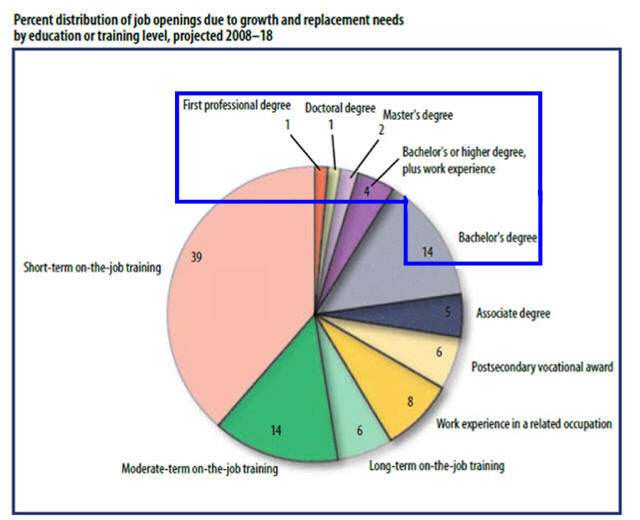
Bureau of Labor Statistics Projections Were
Correct
Employment
by typical entry-level educational requirement,
Source 2008-18 Projections
|
|
Over Supply
and Low Demand
|
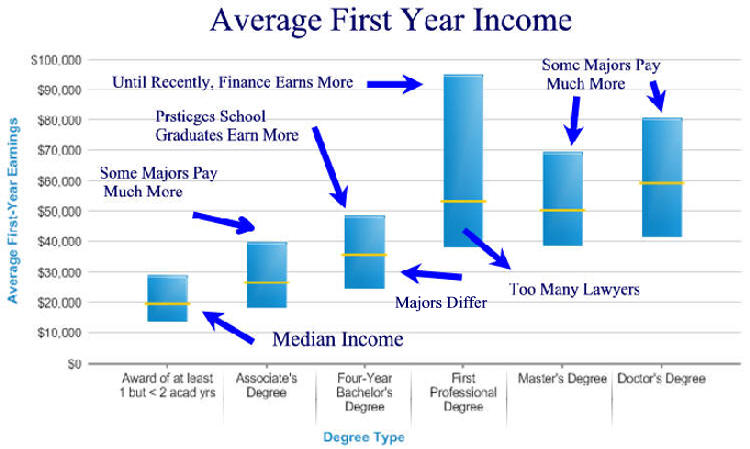
Distribution of Income Among Majors Has Not Changed Much
|
Which 1993 College
Graduate Majors Had The Highest Paying Jobs in 1994 | |||
| Table 1 of 4 College Major: Listed High to Low 2003 Income | Percent of Class | Average Full Time Salary in 1994/2003 using constant 2003 dollars (%increase) | Advanced Degrees |
| Engineering (Electrical, Civil, Chemical, etc.) | 6% | 38,900/74,900(92%) | almost 25% had Masters |
| Comp. Sci., Special 2013 Note to Programmers | 2% | 33,400/72,600(117%) | |
| Business/management (Accounting, Finance, Business Administration, Marketing, etc) | 23% | 33,800/65,900(95%) | |
| Health Professions (Tech, Nursing, Veterinary Medicine, Dentistry, Allied Health | 7% | 40,500/65,000(60%) | 19% M, 3% higher |
| Social & Behavioral Science (Psych. Anthrop, Econ, Geog, Soc, Pol Sci) | 13% | 26,500/62,300(135%) | 22%M 9% D or 1st Professional |
| Biological Science (Botany, Zoology, Biochemistry) | 4% | 29,200/62,200(113%) | D or 1st P >31% |
| All Graduates | 99% | 30,800/60,600(97%) | |
| Other-Career Related Majors (Ag Sci, Communication, Pre Law, Lib Sci, Law Enforce, etc) | 14% | 29,200/59,300(103%) | 14%M, 4%higher |
| Math and Physical Science (Math, Statistics, Physical Science) | 3% | 27,100/58,200(115%) | almost 50%M, with <20% D of 1st P |
| Other Academic Majors ( Aft/Am Studies, Women's Studies, Interdisciplinary Studies, etc) | 4% | 26,200/53,200(103%) | |
| Humanities (Hist. Philos. Rel. Lang. Design, Music, other performing and fine arts, etc) | 10% | 25,000/52,800(111%) | M 22%, 6% D or 1st P |
| Education | 13% | 26,600/43,800(65%) | |
| The Rising Value of a Science Degree 10/20/11 | |||
|
1Data from
The class of 1993:
Earnings and occupations by college major, 1 and 10 years after graduation
Editors' Notes: Wouldn't a 20 year
update be interesting. Study was removed. Elka Maria Torpey Chart titles and data arrangement are from www.businessbookmall.com. Data is based upon a nationally representative sample of 11,190 students graduating from 7/92 to 6/93. Editor's Note: (1) Data is the mean, not the median (2) within cohort income variability has been increasing for many years |
Special Note to Programmers
2/2/13 Bill Gates has been touring the U.S. in early 2013 lobbying for newly minted U.S. foreign college graduates to get visas to stay, work and maybe settle. This increase in supply will push wages down and because all new graduates know new technology and often bring more drive to the job, will force out workers with twenty years of experience who will then have to change careers. The useful life of programmers is dropping fast and those devoting time and money to education should be aware of this. See Stem Jobs | ||
|
Additional Information A. Most New Jobs Projections and Salaries B. Fastest Growing1 page C. Highest Paying D) Pay Scale Com E. Advice to College Students and Parents F. Who Gets the Good Jobs and How Much They Pay G. Many Without a Bachelor's Degree Earn High Income H. Longitudinal Study of Class of 1963 Income Visit our Education Libraries for more current information concerning education. |
|
Earlier 1998 Study |
|
Table 2 of 4 Which 1993 College Graduate Majors Had The Lowest Paying Jobs in 1994 and 1997 | |||||
|
Of Those That Left School |
|||||
| College Major: Listed Low to High | % Working
Full Time 1994/1997 |
Average
Full Time Salary in 1994/1997(%increase) |
% Working
Part Time 1994/1997 |
%
Unemployed 1994/1997 |
% Out of
Labor Force 1994/1997 Education |
| Psychology | 67/72 | 19,500/26,300(35%) | 15/11 | 5/4 | 14/13 |
| History | 72/78 | 21,000/27,000(29%) | 14/7 | 5/4 | 9/11 |
| Humanities | 64/71 | 21,300/28,100(32%) | 20/14 | 5/4 | 11/11 |
| Public Affairs & Social Service | 75/85 | 22,000/29,900(36%) | 13/8 | 5/2 | 8/5 |
| Social Science | 73/80 | 22,100/32,800(48%) | 13/9 | 5/3 | 10/9 |
| Biological Science | 52/57 | 22,800/26,700(17%) | 17/10 | 7/5 | 24/28 |
| All Graduates | 73/81 | 24,200/32,500(34%) | 14/8 | 5/3 | 9/8 |
| Math, Comp. Sci., Physical Sci. | 68/81 | 25,400/36,400(43%) | 14/8 | 5/2 | 14/10 |
| Business | 85/89 | 27,100/36,500(35%) | 8/4 | 4/2 | 4/5 |
| Engineering | 76/92 | 30,900/43,800(42%) | 9/3 | 6/1 | 9/5 |
| Health Professions | 73/77 | 31,300/37,300(19%) | 15/13 | 5/3 | 7/8 |
|
1Data is from The Class of 1993: One Year After Graduation and
Four years after graduation: The class of 1993 as published in the Occupational
Outlook Quarterly of the U.S. Department of Labor, Summer, 1998 pp.
11-21 and Winter of 2000-01, pp 17-29. Chart titles and data
arrangement are from www.businessbookmall.com.
Data is based upon a nationally representative sample of 11,190 students
graduating from 7/92 to 6/93. Special Note: The increase in salaries of about 10% per year that took place over the 3 year period is a little misleading as some graduates had earned an advanced degree. The average salary for college graduates where a bachelors degree is the highest degree would be lower. | |||||
|
Table 3 of 4 In 1994, Fifty-Six Percent of 1993 College Graduates Had Jobs Related to Their Major2 | ||||
|
College Major |
Percentage Working in this Profession | |||
| Health Professions | Health Professions-60% | No computer technician-8% | Computer Science/ Programmer-8% | Admin/clerical support-7% |
| Education | Teaching-57% | Other Professional-13% | Admin/clerical support-13% | Bus./Mgmt.-9% |
| Public Affairs & Social Service | Other Professional 32% | Protective Services-22% | Bus./Mgmt.-16% | Admin/clerical support-15% |
| Business | Bus./Mgmt.-31% | Other Professional-26% | Admin/clerical support-24% | Sales-12% |
|
Graduates with these majors often require | ||||
| Engineering | Engineering-54% | Bus./Mgmt.-12% | Other Professional-10% | Comp.Sci/ Programmer-8% |
| Math, Comp. Sci. Physical Sci. | Comp.Sci/ Programmer-26% | Admin/clerical support-17% | Teaching-12% | Other Professional-12% |
| Biological Science | Other Professional-17% | Admin/clerical support-17% | No computer Technician-16% | Bus./Mgmt.-9% |
| Social Science | Admin/clerical support-27% | Bus./Mgmt.-26% | Other Professional-21% | Sales-10% |
| History | Bus./Mgmt.-24% | Admin/clerical support-18% | Teaching-15% | Other Professional-15% |
| Humanities | Other Professional-30% | Admin/clerical support-21% | Bus./Mgmt.-17% | Teaching-11% |
| Psychology | Admin/clerical support-27% | Bus./Mgmt.-26% | Other Professional-21% | Sales-10% |
| 2Data is from The Class of 1993: One Year After Graduation as published in the Occupational Outlook Quarterly of the U.S. Department of Labor, Summer, 1998 pp. 11-21. Chart titles and data arrangement are from www.businessbookmall.com. | ||||
|
Table 4 of
4 By 1997, Fifty-Five Percent of the
Class of 1993 had a Job Related to Their Major, |
||||||
|
Attributes of current job |
||||||
| Bachelor's degree required |
Related to major |
(job has) Career potential | ||||
| 1994 | 1997 | 1994 | 1997 | 1994 | 1997 | |
| All graduates | 56 | 62 | 75 | 55 | 72 | 55 |
| Professional Fields | 64 | 68 | 83 | 65 | 76 | 55 |
| Health professions | 73 | 80 | 91 | 82 | 80 | 55 |
| Engineering | 79 | 79 | 87 | 60 | 82 | 64 |
| Education | 66 | 69 | 79 | 67 | 75 | 50 |
| Business and management | 51 | 57 | 85 | 57 | 77 | 60 |
| Public affairs and social services | 49 | 55 | 72 | 58 | 68 | 47 |
| Arts and sciences | 49 | 60 | 60 | 45 | 64 | 51 |
| Mathematics, Computer and physical sciences | 68 | 71 | 82 | 63 | 75 | 62 |
| Psychology | 45 | 64 | 57 | 48 | 53 | 48 |
| Biological sciences | 49 | 63 | 64 | 51 | 57 | 45 |
| History | 41 | 57 | 42 | 34 | 67 | 52 |
| Social science | 47 | 57 | 57 | 33 | 68 | 53 |
| Humanities | 45 | 50 | 58 | 40 | 66 | 50 |
| 1Chart is from Four years after graduation: The class of 1993 as published in the Occupational Outlook Quarterly of the U.S. Department of Labor, Winter of 2000-01, p 9. Data is based upon a nationally representative sample of 11,190 students graduating from 7/92 to 6/93. | ||||||