Price of
Item of Interest (x) Average Weekly Earnings1
x in 1982
dollars
(x/CPI)100
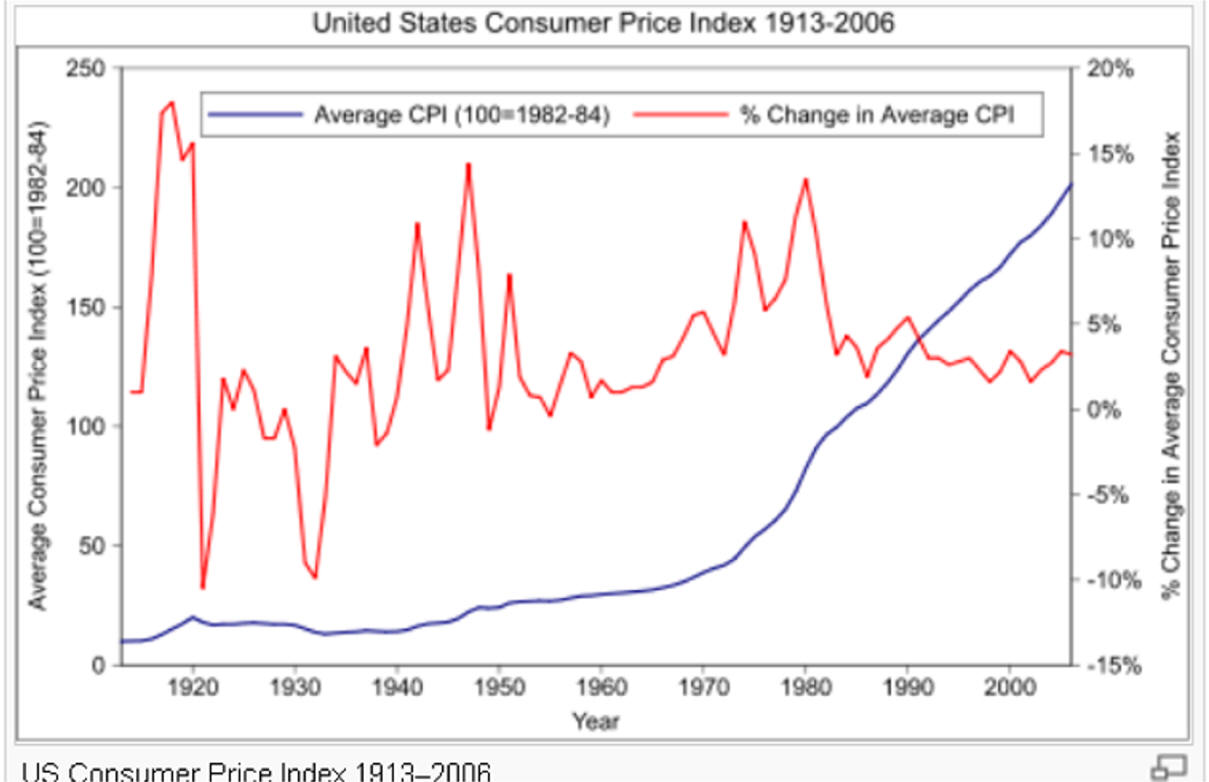
1980
$505
(505/592)100
85
$235.10
276.59
1981
$557
(557/592)100
94
$255.20
271.49
1982
Pb = $592
(592/592)100
100
$267.26
267.26
1983
$611
(611/592)100
103
$280.70
272.52
1984
$637
(637/592)100
108
$292.86
271.17
1Data
is from page 360 of the 2000 Economic Report Of The President
Analysis: After adjusting for inflation, it is apparent the
item of interest (salary) did not keep up with inflation.
This person was making one hundred and fifty-three 1982 dollars less in 1984
than they were making in 1980.
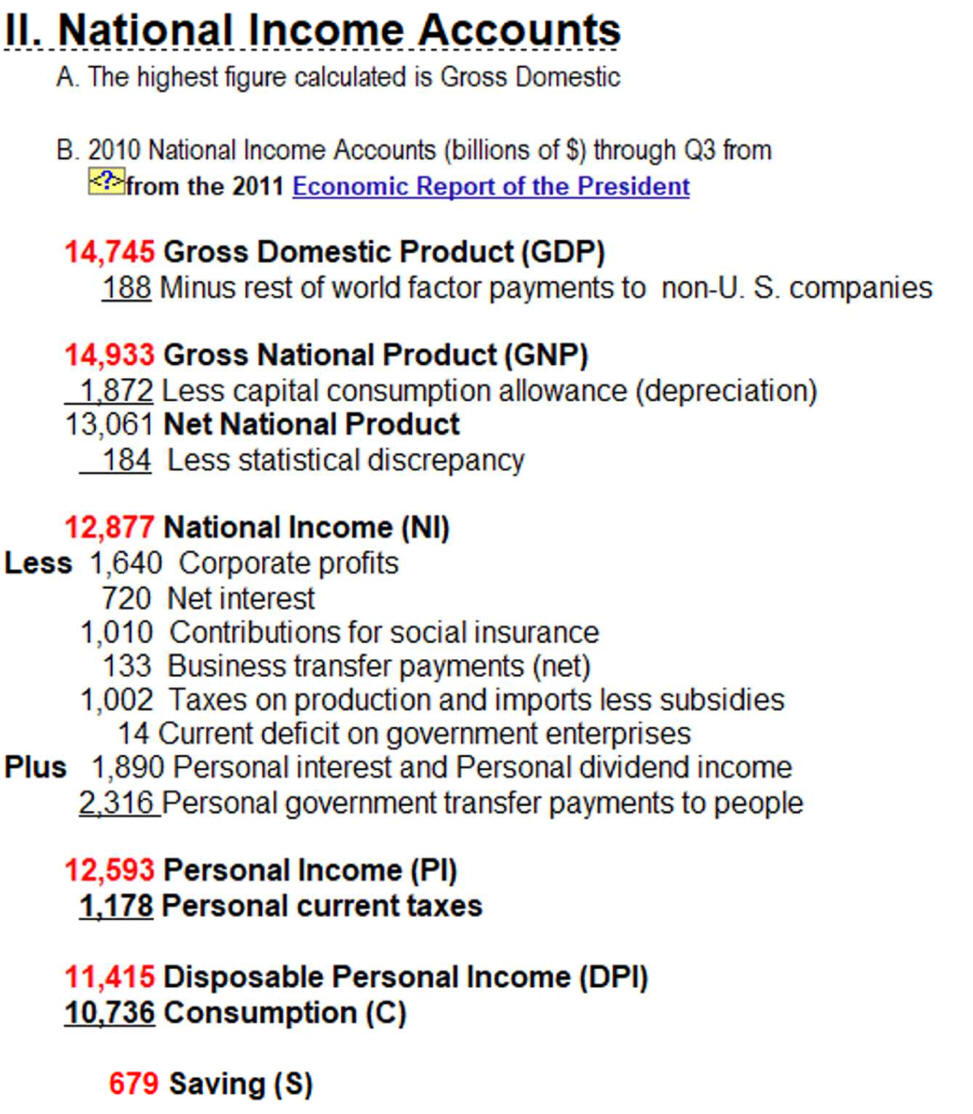
D.
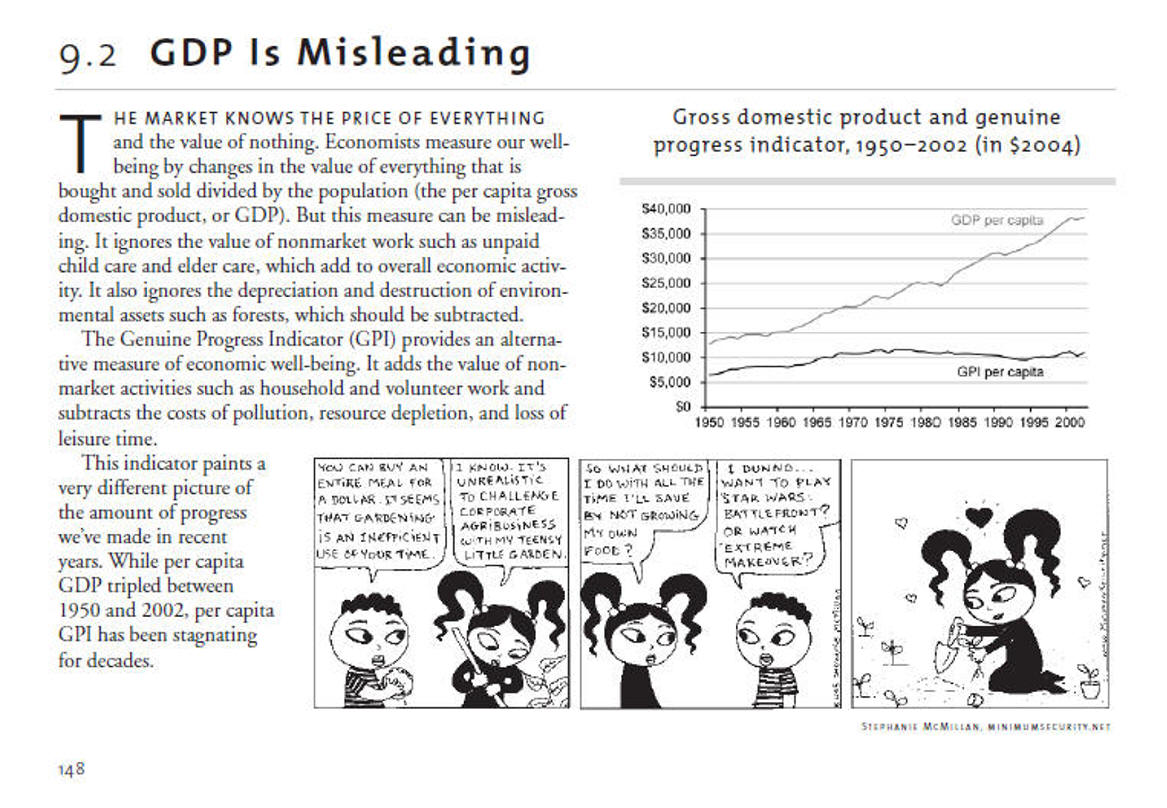
Genuine
Progress Indicator
(GPD) attempts to make up for important
economic activities
not measured by GDP.
E. Read
Analyzing durable goods over time, from
seeking alpha 7/26/13
by
Doug Short Editor's Note:Attempts to measure the quality of goods, value of
services and the
volume of the underground economy are poor at best and
if they are a growing portion of economic activity; the degree to which GDP
underestimates
economic activity will grow increasing middle class anxiety,
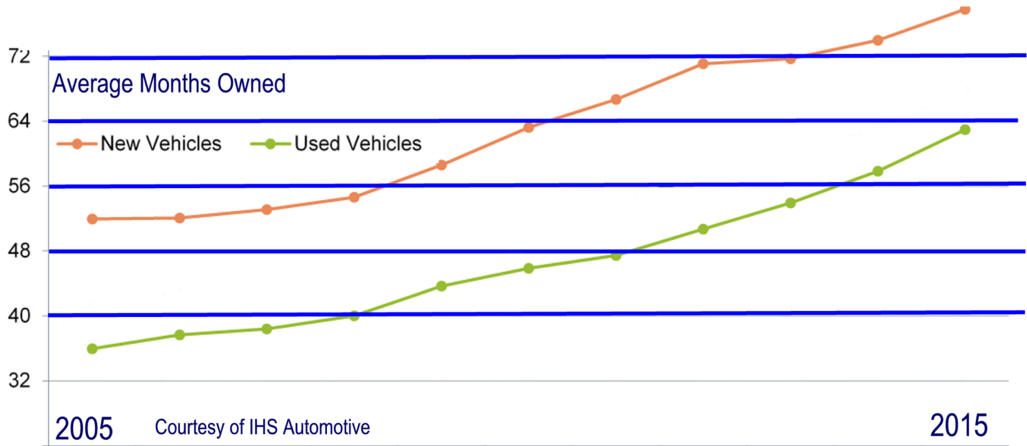
Vehicle Age Demonstrates GDP Failure to Measure
Output
1. Estimated value of new vehicles added to GDP is understated
as is the wellbeing of the owner.
2. GDP from used vehicles severely understated as is the wellbeing of new often
middle income owners.
3. GDP also doesn't measure the gain to medium income owners from no-fault
insurance.
The ability of GDP to adequately measure
total U.S. economic activity and the resulting wellbeing has decrease
dramatically over the last one-hundred years. Its undervaluation of economic
activity has grown. This has resulting in productivity growth being
undervalued. The inability to measure product quality and the value of services
has added to the problem. GDP's ability to adequately measure the value of
automobiles, TVs and Smart Phones will be contrasted.
The
automobile and its related infrastructure and TV were
easily measured by GDP. The auto production increased employment dramatically. TV
production increased employment somewhat but production techniques improved
lowering both cost and
employment dramatically as
did the contribution to GDP and productivity. Then came the
cell/smart phones. Their increase consumer wellbeing was similar to vehicles and TV's
but production cost and sales value were relatively minor as was the increase in
GDP, employment and productivity..
How do you measure the GDP of a smart phone. Its a phone, a TV, a tape recorder,
a camera, a movie camera, a library.... Add the cost of said items in 1950's and
60's prices to today's GDP. How much income did it take to buy these items 50
years ago during the glory days of GDP and income growth. Now add the drop in
cost phone call across the country to income. If you take, save and send a picture
little is added to GDP, productivity and income. But there is value. Now adjust for quality. Color TV, Now estimate the
value of all this being portable. The middle class has a lot more income and
wellbeing than is
being measured. Last night I watched Taxes beat Notre Dame on my phone while
first watching a Blue Ray DVD on my movie screen sized TV. Then I switched to
streamingBosch
on Amazon TV and finally ended up watching golf on Direct TV. The Boston Braves
moved out when I was 12 and my life came to an end. Since retiring to Florida I
have continued to watch the PATs.
Major scientific accomplishments such as aspirin, penicillin and curing
childhood diseases pile up and contribute to wellbeing not according to GDP. Soon to come gene therapy. How can you measure making a
blind person see? For a comparison of today with past see
Recent Decades Ranked By Problems
Editor's Note:
GDP includes an estimated quality improvement but to me some items make such
a large improvement that increased GDP must be dramatically understated. The
automobile was the first great consumer good GDP measured and it along its
infrastructure were easy to measure and GDP increased substantial. Employment
also increased dramatically Then came the TV. It also represented a tremendous
increase in wellbeing but over time production techniques dropped dramatically
as did GDP and the employment required per unit of enjoyment. Then came the
cell/smart phones and the enjoyment was as large as vehicles and TV's but cost was minimal and so was the
increase in GDP and employment. Other major scientific accomplishments
as aspirin, penicillin, curing childhood diseases pile up and contribute to
wellbeing but GDP and employment are minimally affected. Soon to
come gene therapy. How can you measure making a blind person see?
If GDP is so much larger why are so many unhappy?
One reason is the yellow journalism created of fear pornography which used to
result from because of major national events. Then technology got
inexpensive, sources of news multiplied and reaching people required little
capital investment meaning reaching a small group could meaningfully increase
profits.
Fear pornography for a particular event appeals to a fairly small audience
but this can mean huge profits. No longer is a major world event like the U.S.
1961 blockade of Cuba needed to generate a meaningful and profitable
audience. Today, by naming snowstorms, The Weather Channel has reached a
significantly larger audience who must watch the track of this particular
disaster. As bad as a school shooting is fear affects enough people so CNN ran a
Connecticut tragedy 24 hours a day for four plus days. Years ago a land
falling hurricane was needed to move the ratings. But there are a few who must
watch this media created disaster and CNN, Fox
and others make big bucks.
This continues a sequence
of posts aiming to show how apparently objective statistics conceal
large numbers of arbitrary value judgements.
This is the 8th post, which considers comparisons of GDP across time
within a single country.
In comparisons across
countries, we face the difficulty that the concept of “wealth” has
varied across societies, and changed with time. The “average basket” of
goods varies for each country, because different societies have
different preferences and values. We cannot compare apples and oranges.
It seems that these problems would be reduced if we considered a single
society across time. The concept of wealth, and the average bundle of
goods would remain relatively stable, at least across short periods of
time. We will now discuss difficulties which arise when we consider
growth across time, comparing GDP across the years for a single
country. read
more
Income inequality in the United States: it’s flatter than you probably
realize (Phillip
W. Magness)
Magness reviews distortions introduced in Piketty-Saez analyses by incorrect
treatment of U.S. tax laws in their calculations. Magness has
constructed what he says is a corrected income distribution curve for the
U.S. Econintersect:
Of course, none of this impacts wealth distribution which also has gone
through extreme swings.
Measuring
Wellbeing
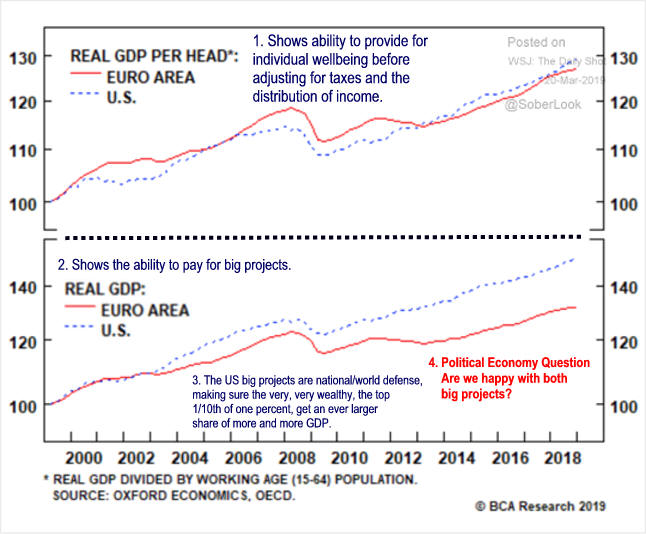
Charles Jones and
Peter Klenow proposes
an interesting new measure of economic welfare. It is by no means
perfect, yet it is considerably more comprehensive than median
income, taking into account not only per capita consumption,
growth more is better changes in working time. less is better
life expectancy more is better
and inequality less is better
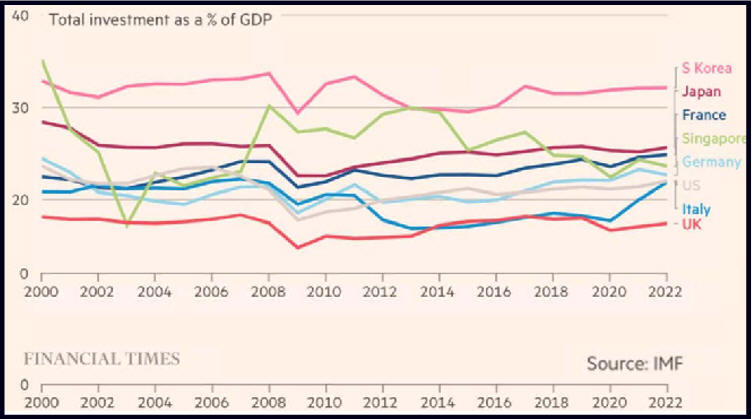
Analysis:While U.S. has easily the most income per capita, UK is second
with 25% less, is only slightly ahead in wellbeing,
The French
Take long vacations and retire earlier, and so they typically work
fewer hours. Their higher life expectancy at birth (80 years in
2005, compared to 77 in the United States), presumably
reflects advantages with respect to health care, diet, lifestyle,
and the like. Their income and consumption are somewhat more equally
distributed than is the norm in the United States
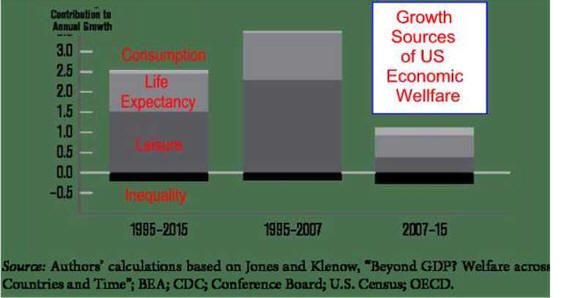
Our extension of the
Jones-Klenow analysis shows U.S. economic welfare has increased
at about 2.3 percent per year since 1995, for a cumulative
gain in two decades of 60 percent. Gains in income and
consumption per capita and in life expectancy are the major reasons
for improved welfare. Increasedinequality of consumption has subtracted
about 0.2 percentage points a year from the welfare
measure since 1995.
Editor: Very
Interesting, very subjective, but basically true.
Two decades before the 2007 crisis, economic welfare improved
rapidly. The gains in welfare were driven primarily by increases
in per capita consumption and by improvements in life expectancy.
Rising consumption inequality subtracted less than 2/10 of
one-percent from the annualized growth rate in welfare during
the pre-crisis period, and changes in leisure/work hours per person
were stable but contributions were small.
Post crisis from
2007–15 economic well-being improved, but slowed considerably, to
just about 0.9 percent per year Per
capita consumption slowed to about 0.4 percent per year—about the
same as the growth rate of per capita GDP.
Disappointing
economic growth is the dominant reason for the slower welfare gains.
The longer-term trend
toward inequality continued and intensified slightly after 2007,
subtracting about a quarter percentage point from welfare growth.