


|
Chapter 7 Market System Participants |
|
|
II. Business Population is Varied
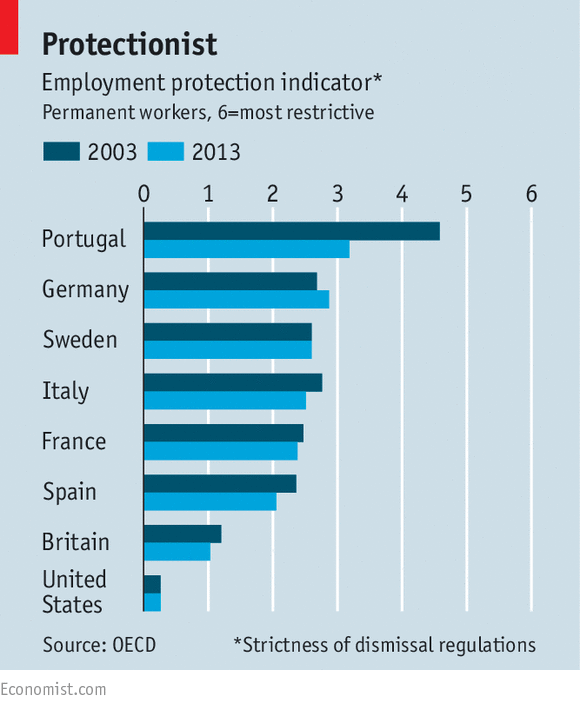
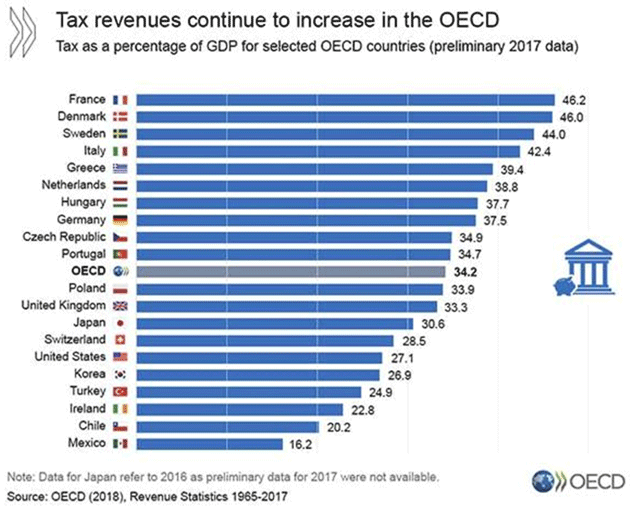
III. Governments Tax, Spend, Regulate
|
Test Review Notes Chapters 1-7
Return to Economics Internet Library
4/1/24 Please Share |
|
|
Political Economy
|
|
|
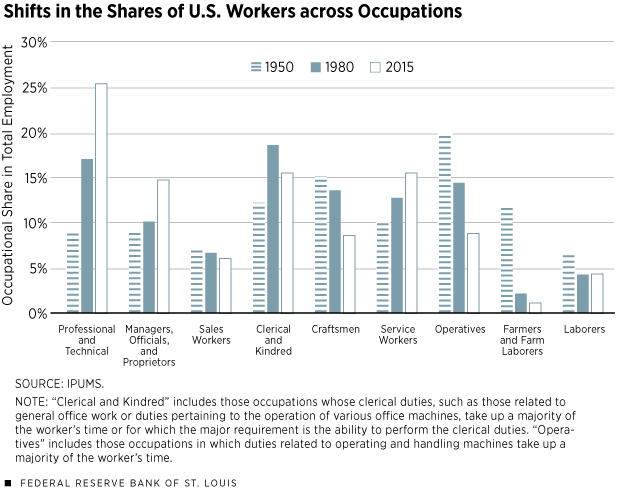
II. Varied Business Population
A. Businesses types 1. Manufacturers 2. Transportation 3. Wholesalers 4. Retailers 5. Services
|
|
|
|
B. Business Produce
|
|
|
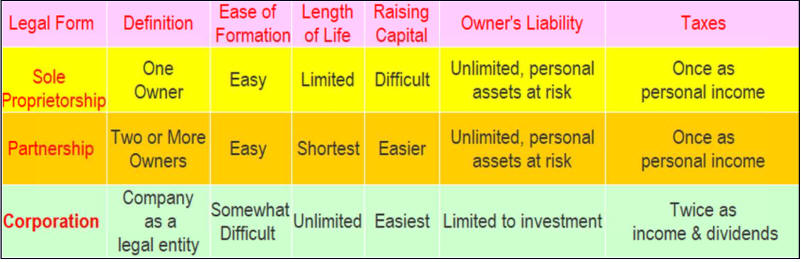
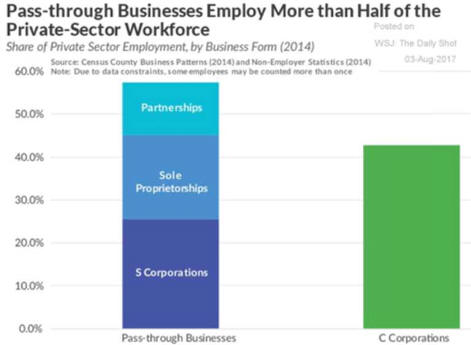
C. Legal Forms of Business
|
|
|
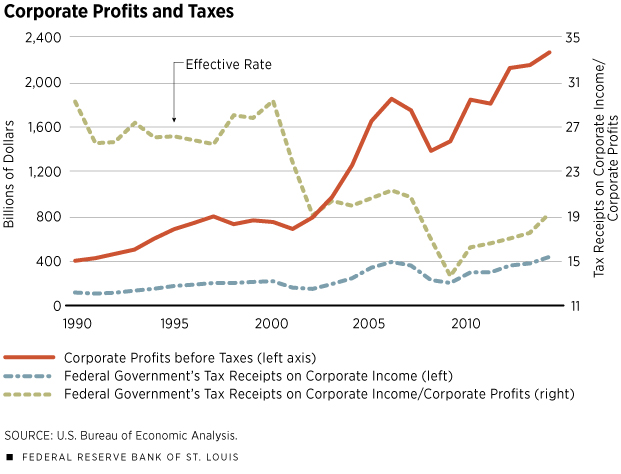
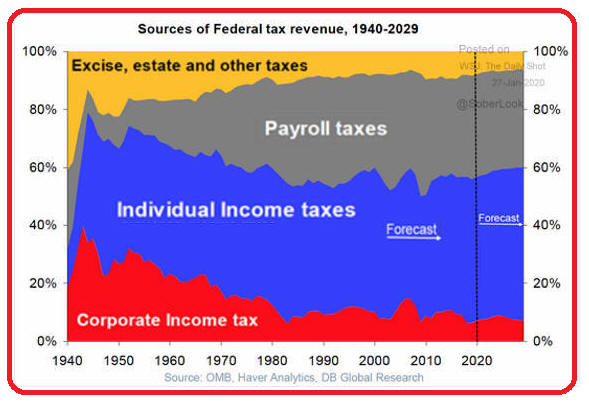
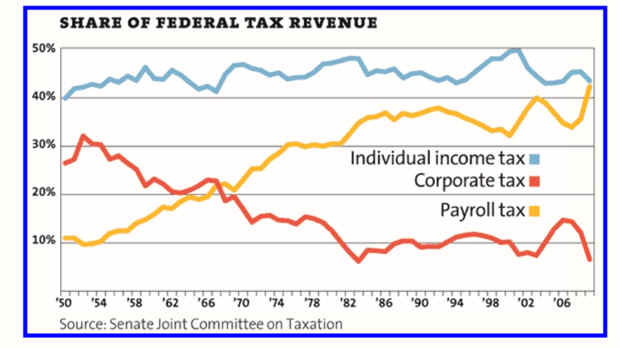
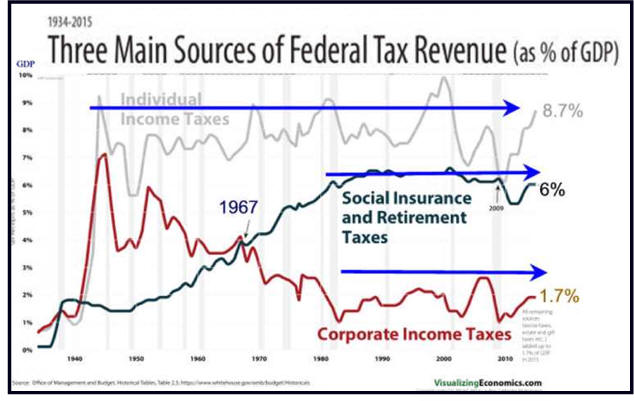
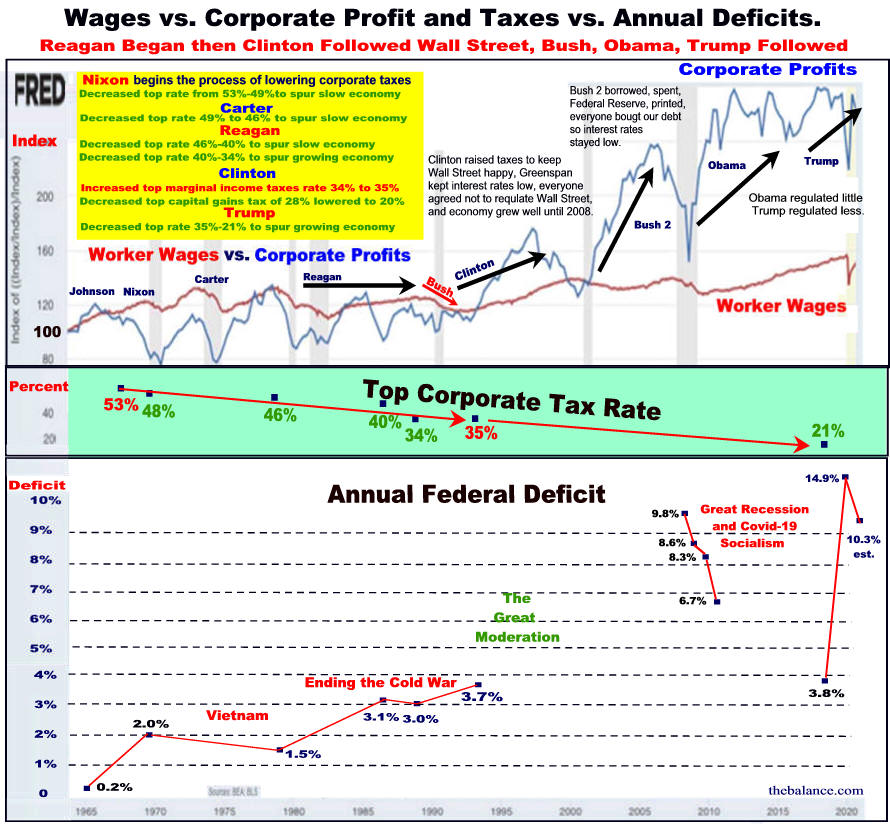
D. Corporate Profits Up Income Tax Paid Down Payroll Taxes Replace Income Taxes
|
|
|
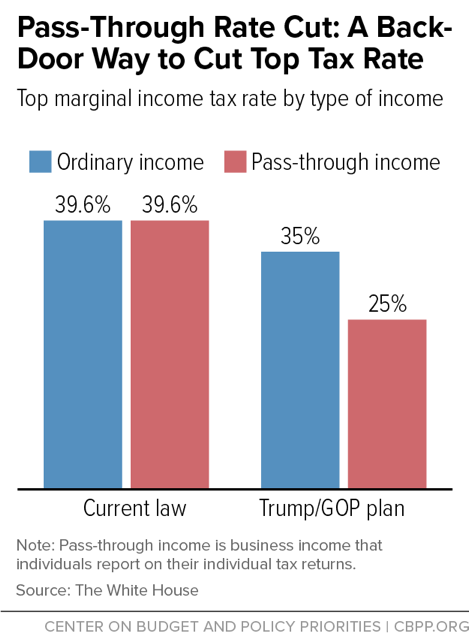
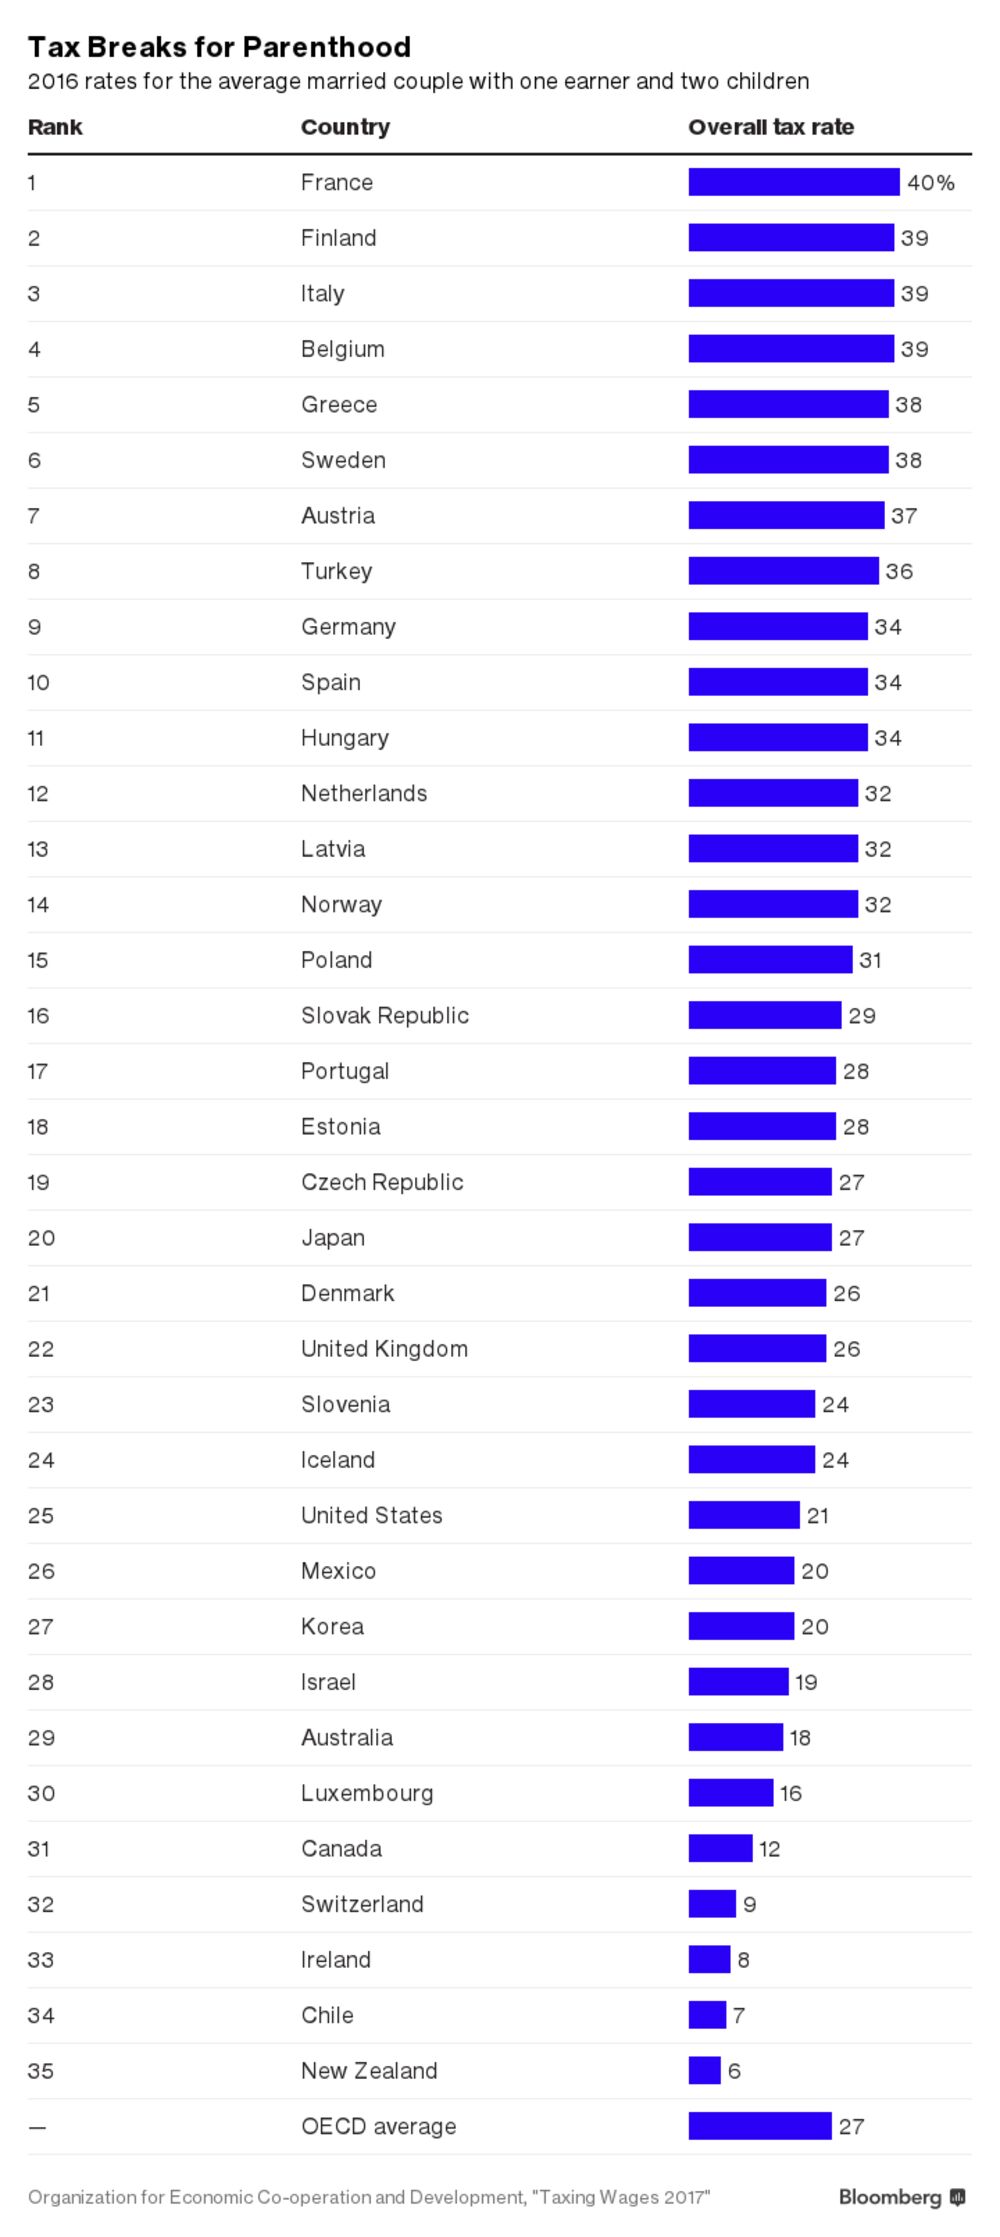
E. Pass through, pay lower personal tax rate.
|
 |
|
III. Governments Spend, Tax and Regulate
B.
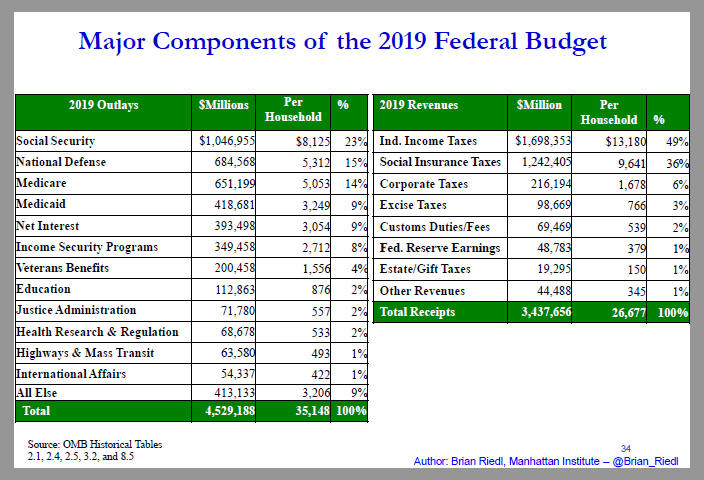
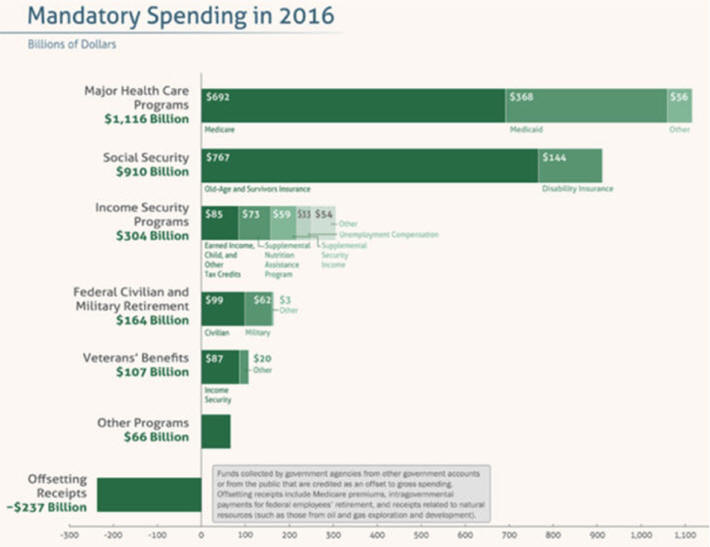
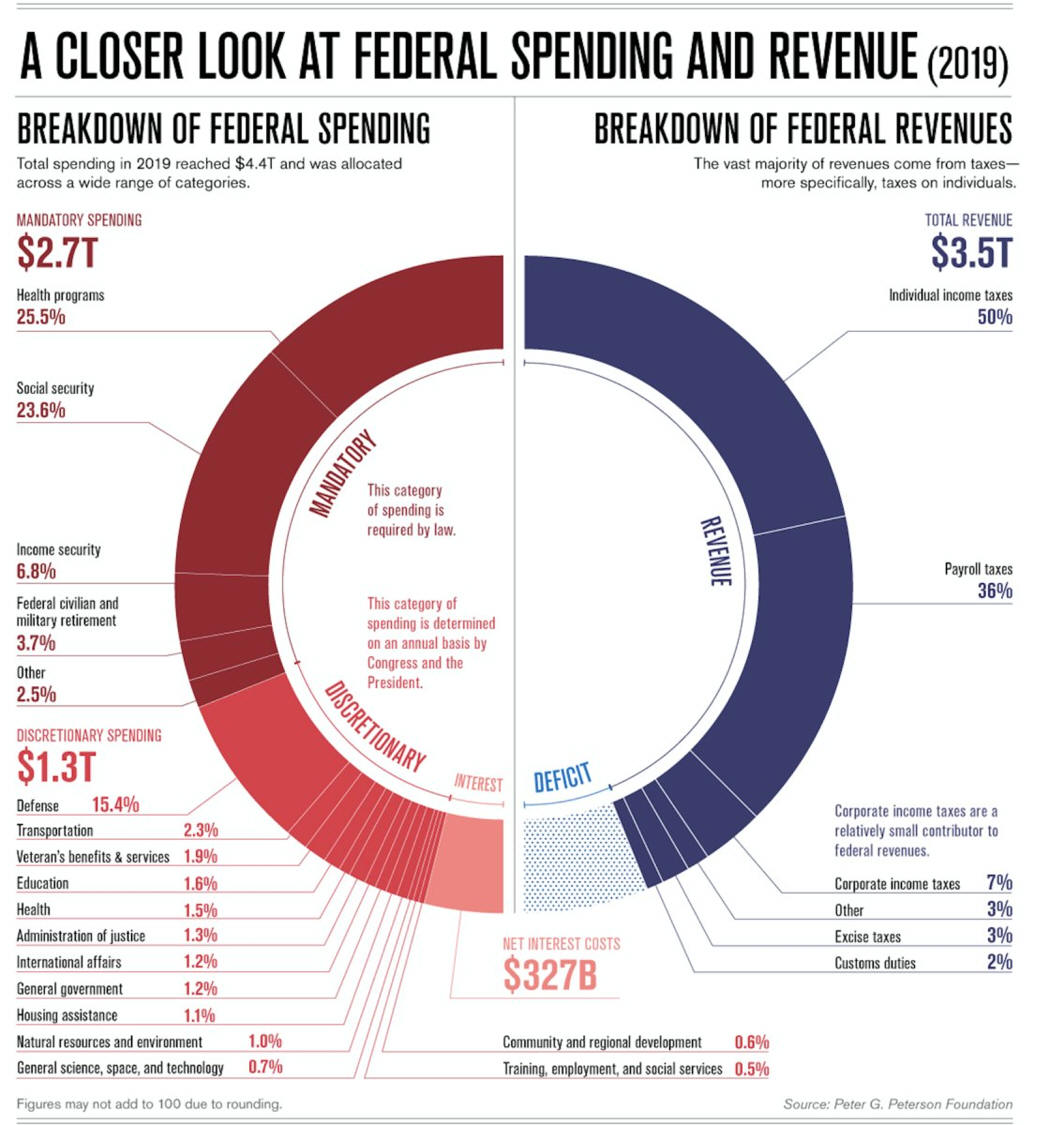
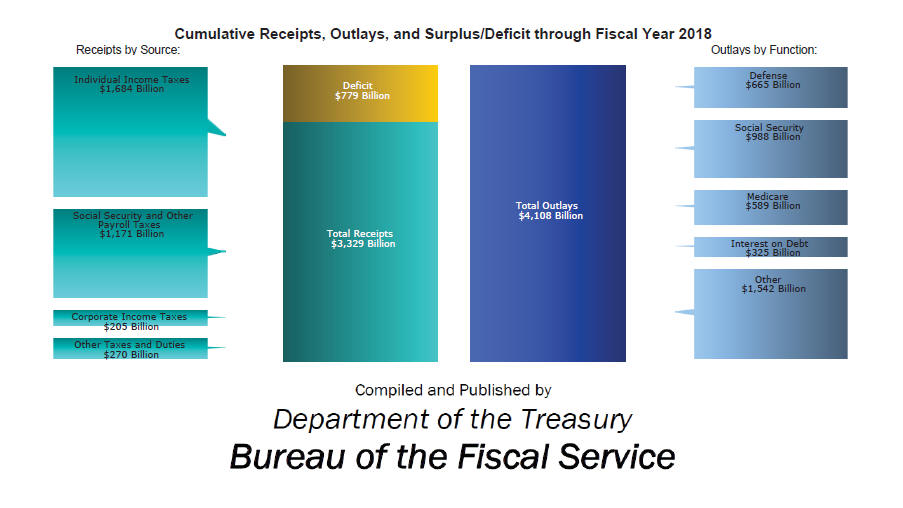
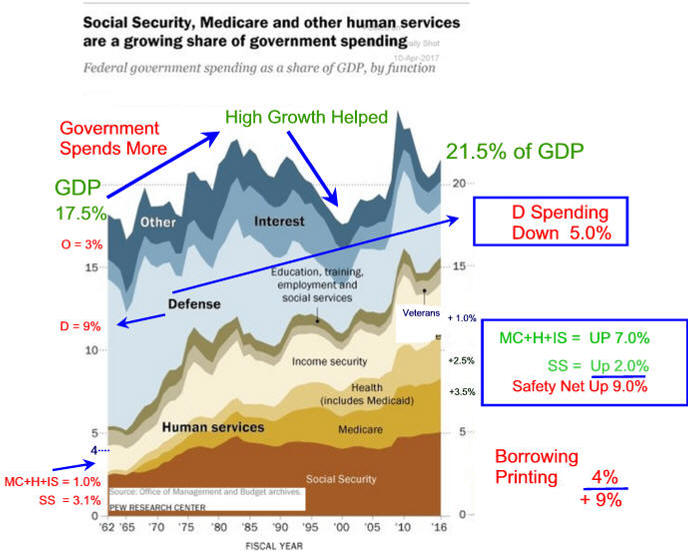
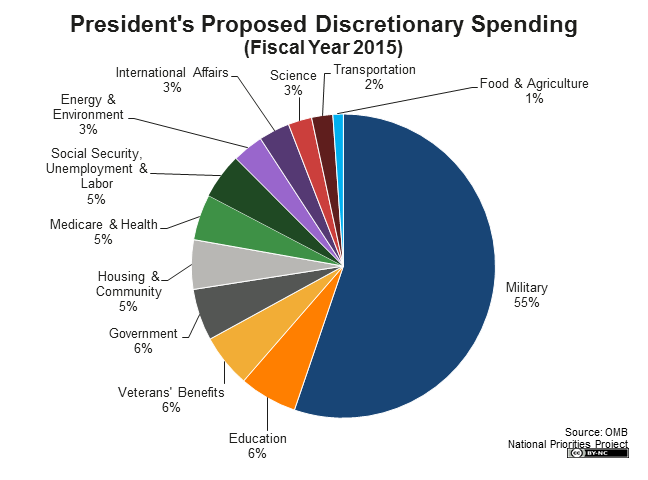
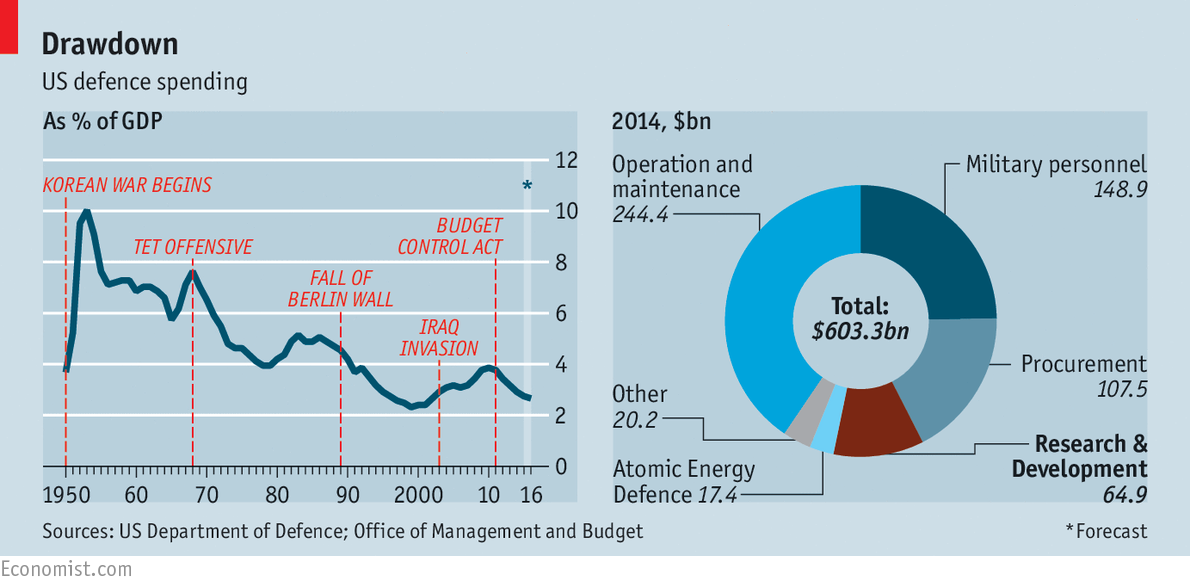
Federal Government Spending
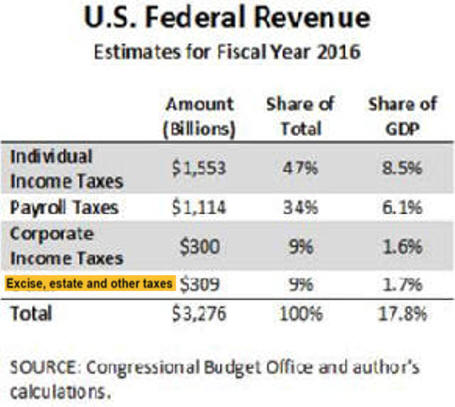
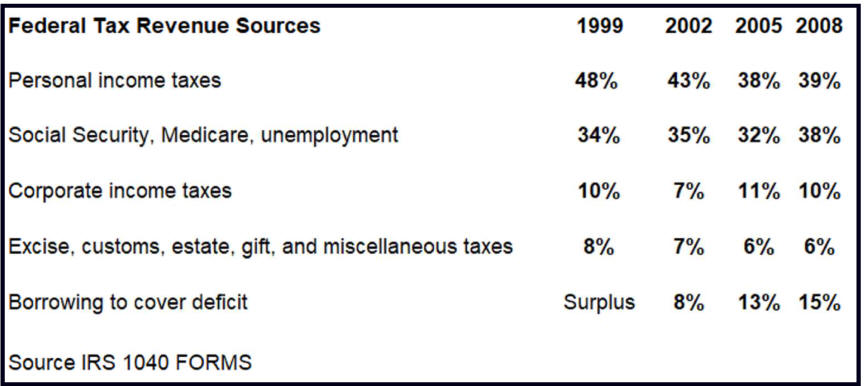
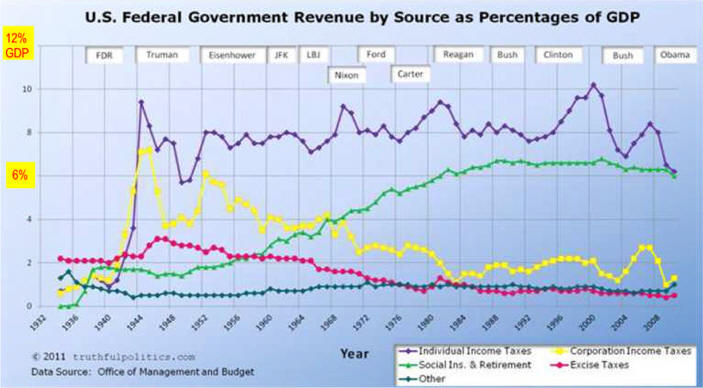
C. Federal Government Receipts
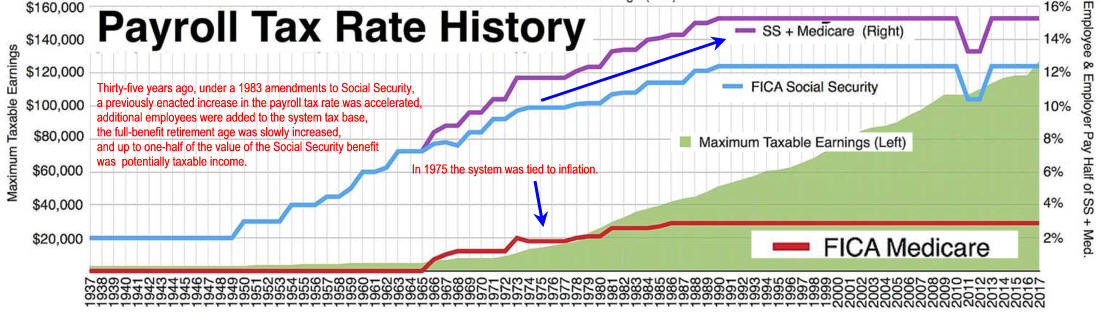
2. Payroll Taxes a. social security and Medicare
a. both employer and employee pay)
3.
Corporate Income Taxes
5. Licenses and Fees
6.
Is
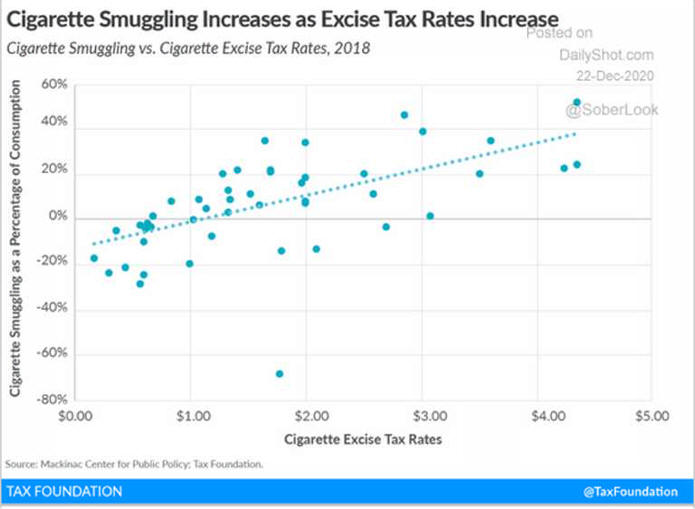
border adjustment good tax policy?
See
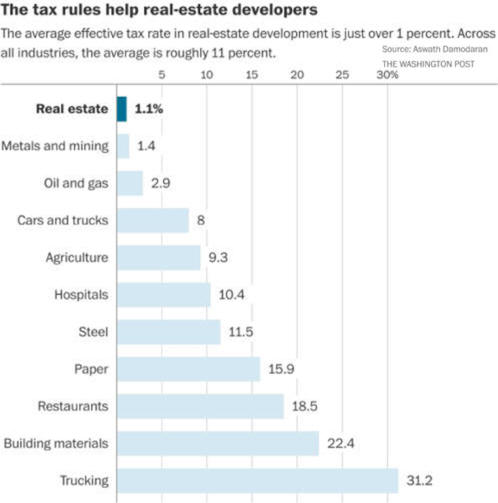
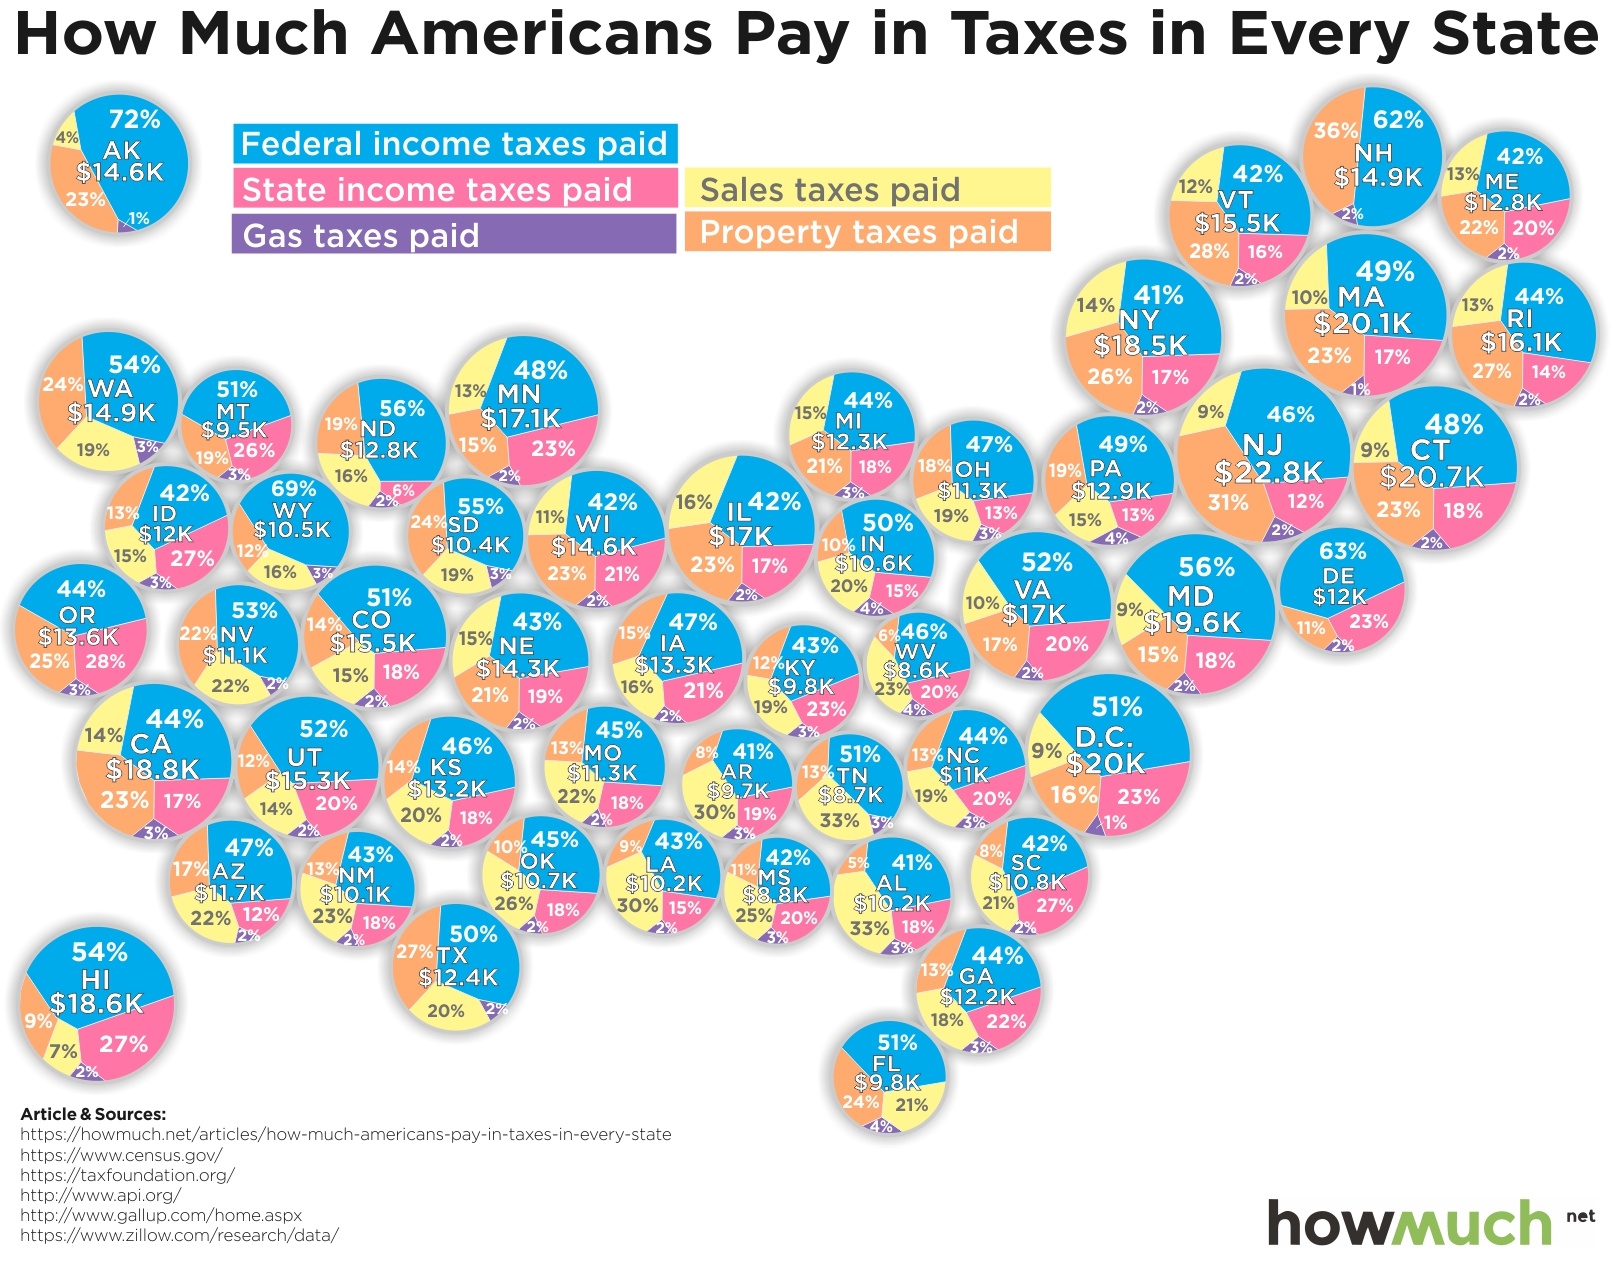
Who Owns US Businesses
and How Much Taxes Do They
Pay |
|
|
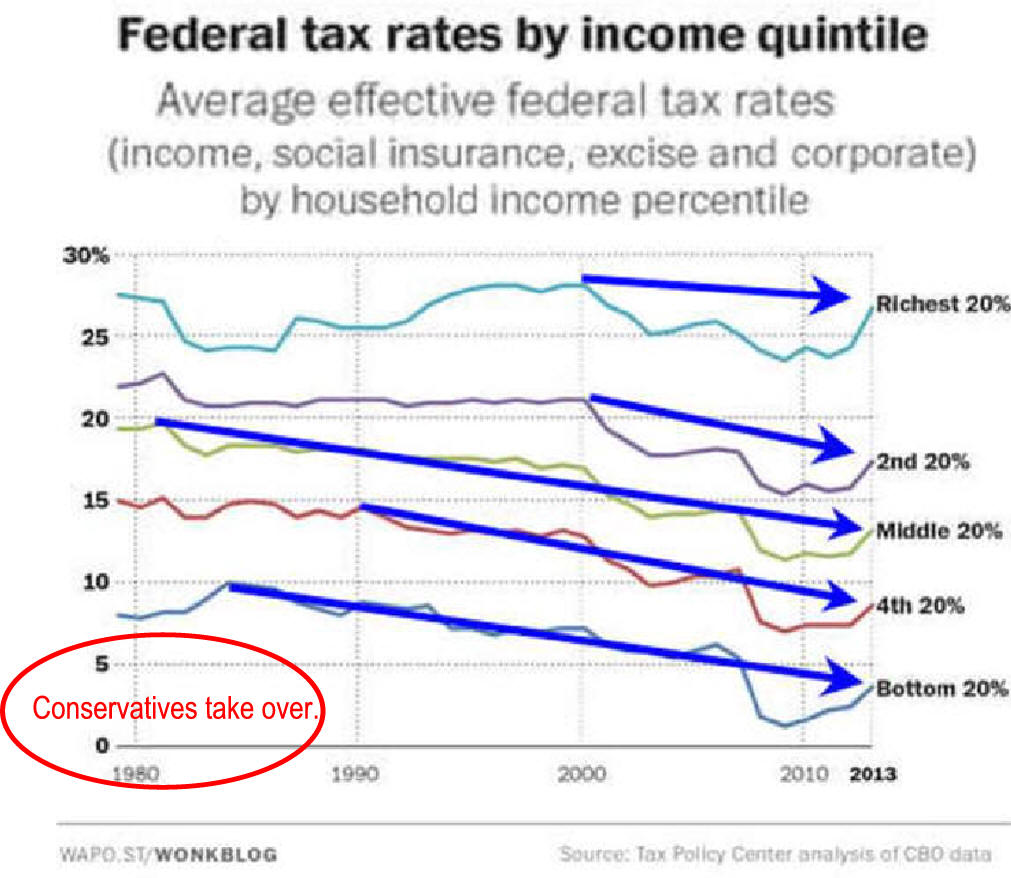
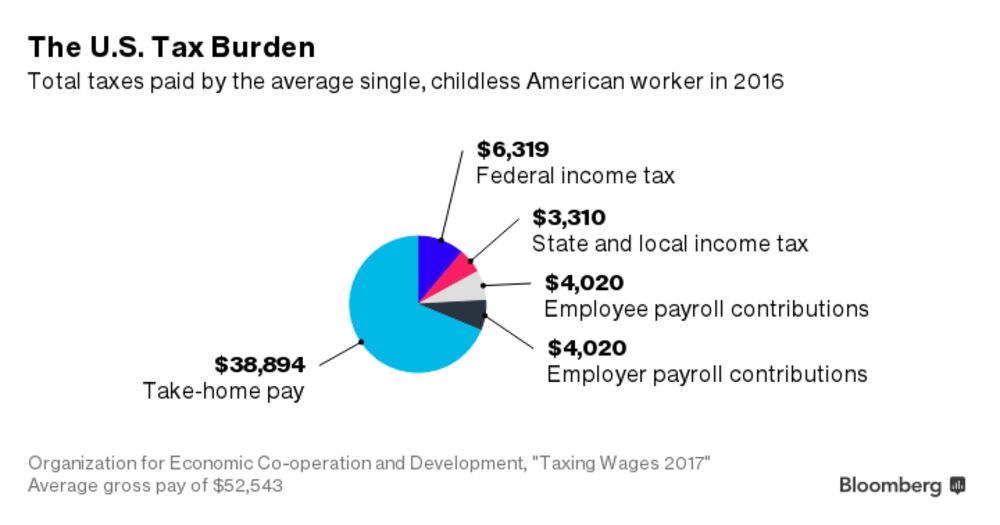
The drop in corporate total taxes from 5.5%
to 4.0% was not small.
|
|
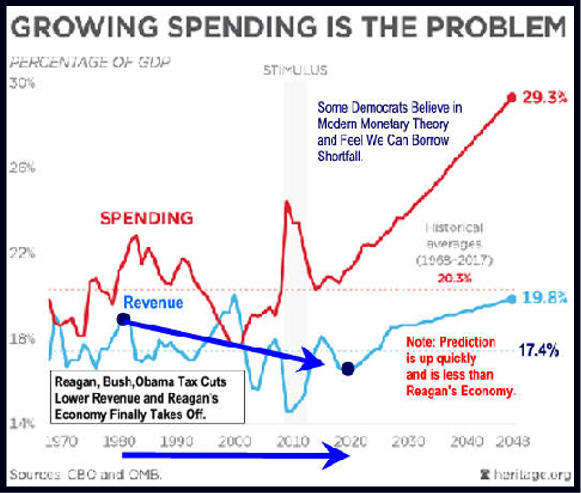
D. Government Spends More Than It Collects
|
|
|
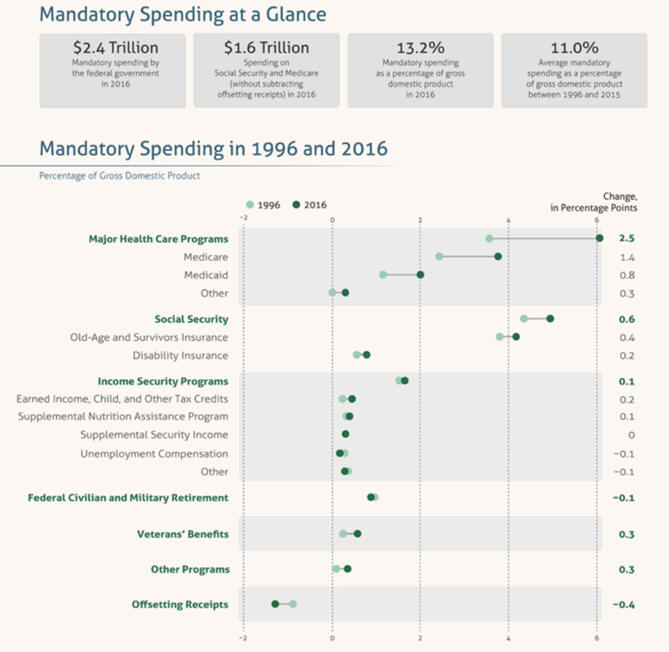
E. Much is Required by Existing Law
Source:
|
|
|
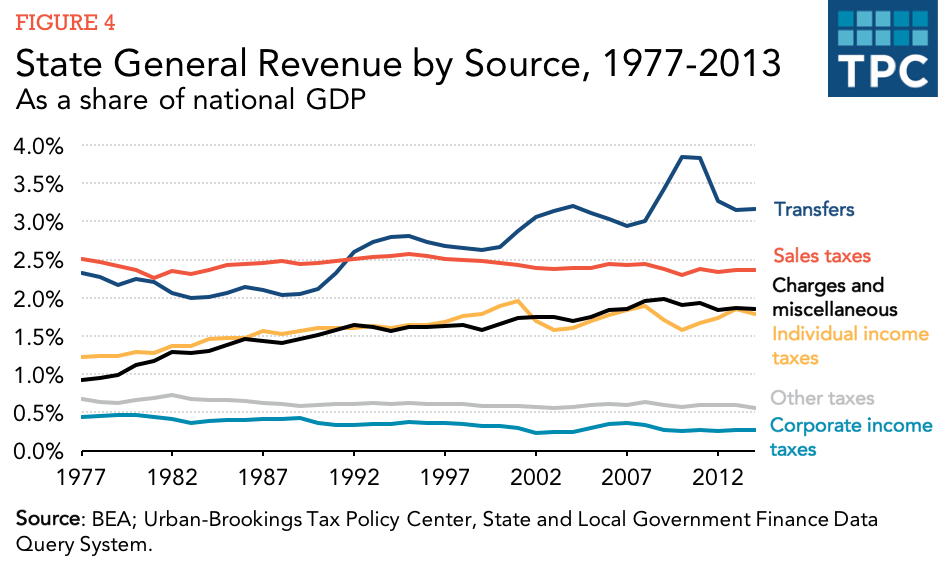
F.
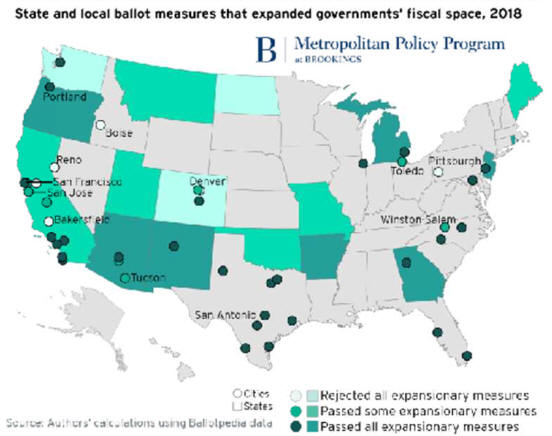
State and local government
2. Property Taxes are differ from state to state
|
What the 2018 elections mean for state and local spending
|
|
|
|
|
|
|
IV.
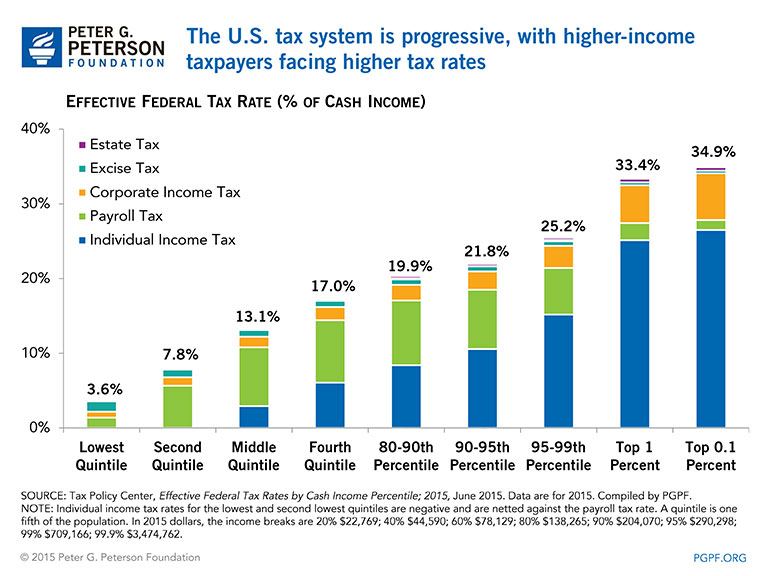
Taxation Philosophies Unit IV Review Ability to pay and benefit received are taxing philosophies
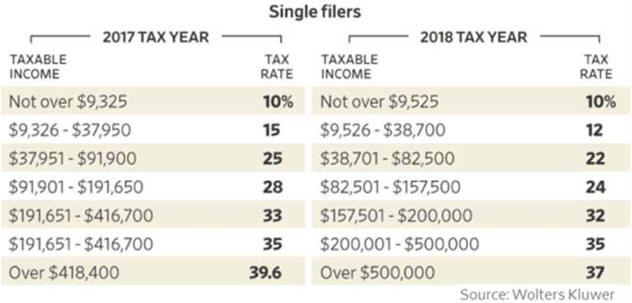
V.
Tax Rate Types
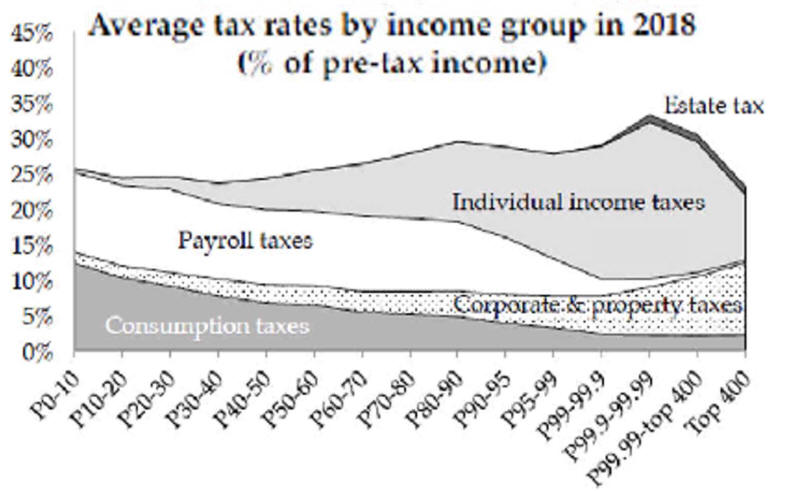
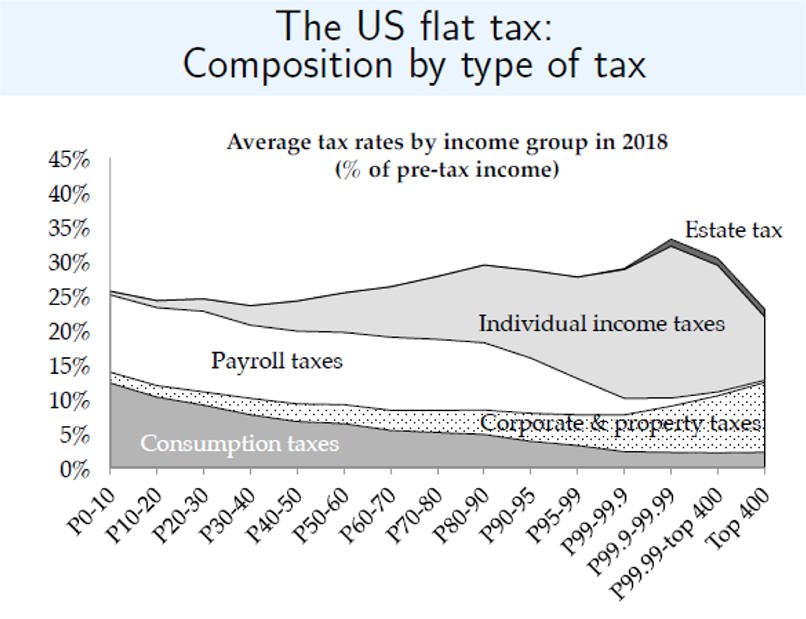
C. Regressive
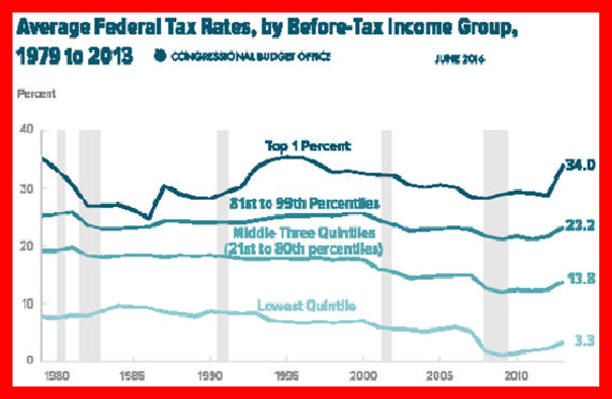
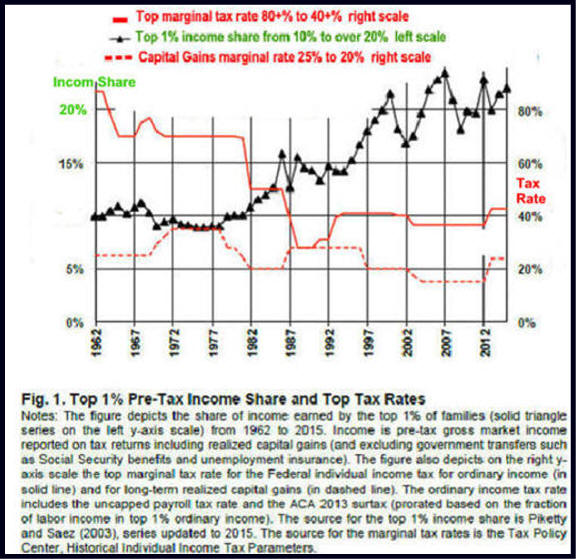
Very-Rich Top 1% of Income Going Up
D. Passing
Tax Incidence
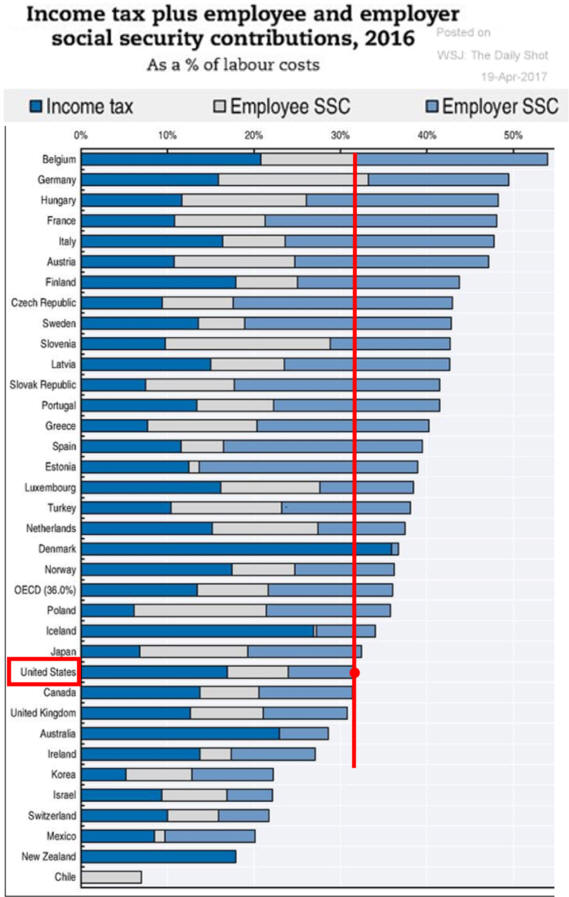
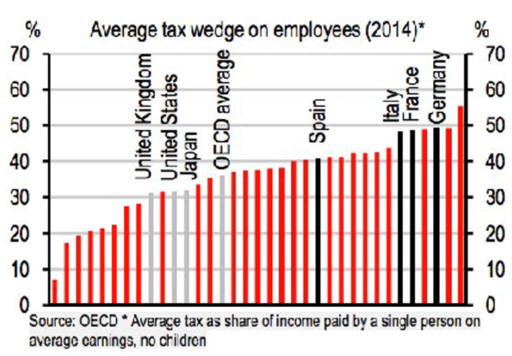
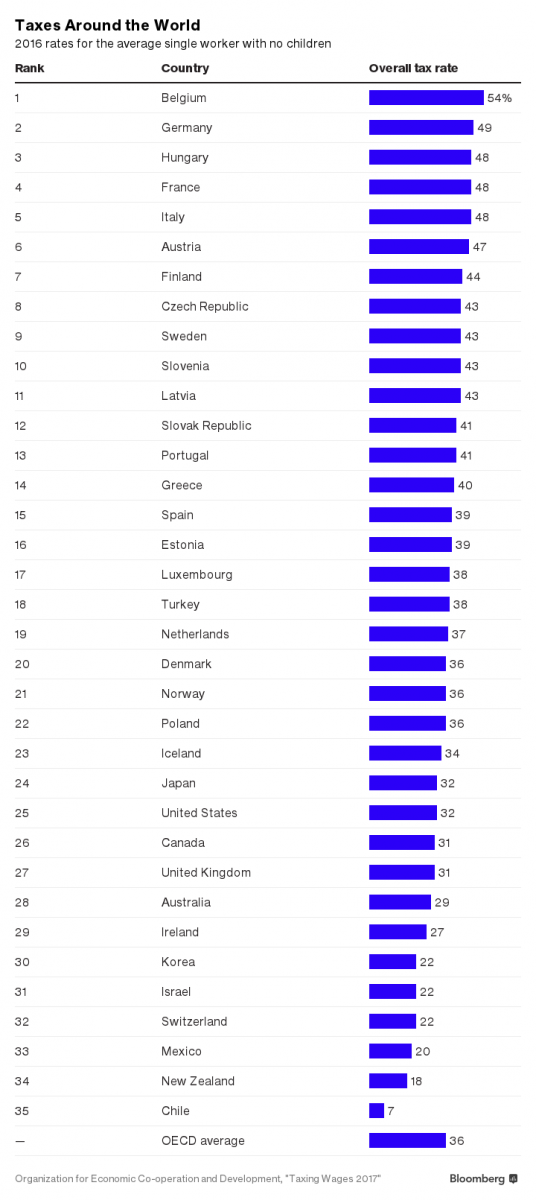
F. "The “tax wedge”, the difference between total labor costs to the
employer
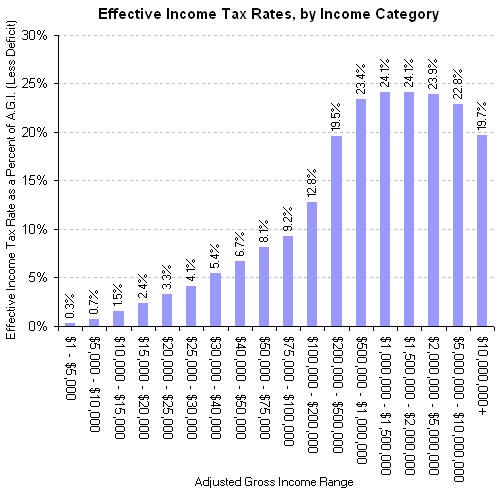
G. Effect Rates
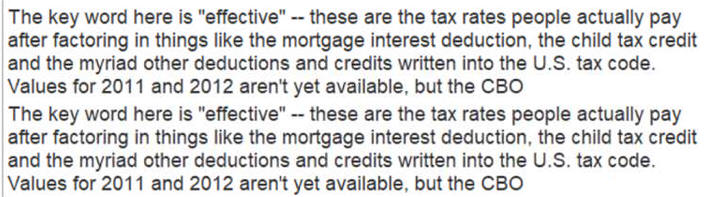
H. Average Tax Rate from Wiki its taxes paid/ taxable income
H.
The-global-cost-of-tax-avoidance
IMF reporting that around $600 billion is lost due to profit shifting every year
|
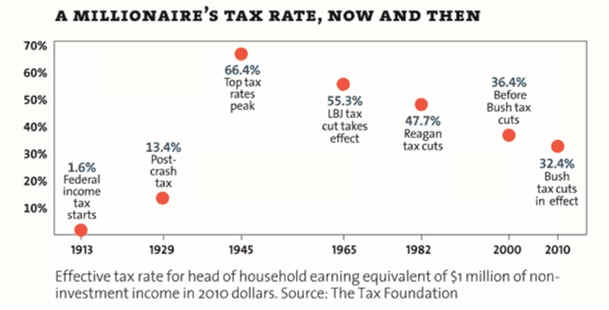
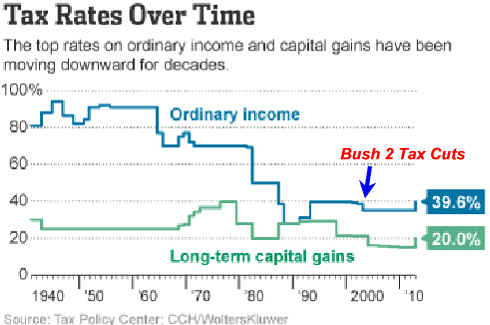
Tax Rates Have Gone Down.
Some Want Taxes the Wealthy.
Some Sat Tax Where the Money Is!
The Math Problem That Could Sink the Bernie/AOC Agenda
Very-Rich Top 1% of Income
Payroll Taxes are Very Regressive
One important point is people with low
earnings die early then the wealthy
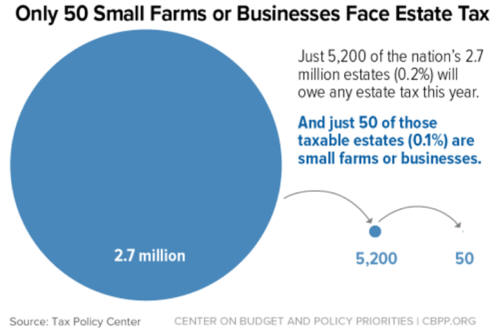
the myth-that-the-estate-tax-threatens-small-farms
|
|
VI.
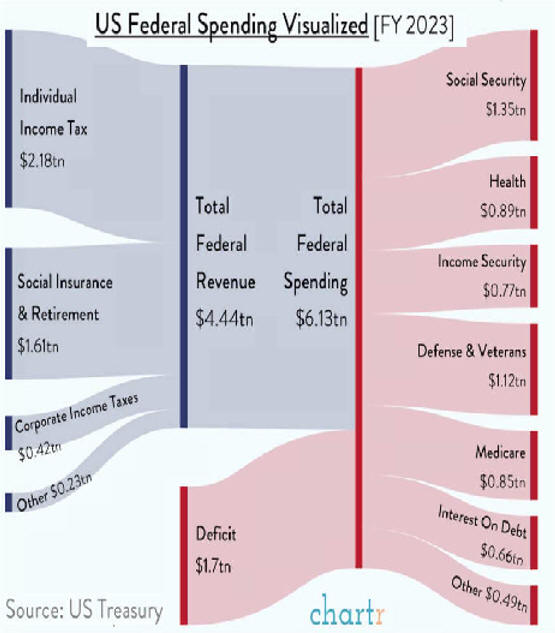
Federal Revenues and Expenditures
|
Federal Spending Up blogs.wsj.
|
|
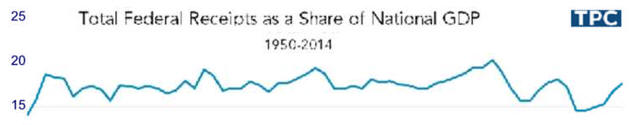
Taxes Flat
|
||||||
| C. Outlays
Because Tax Revenues have changed little,
|
1999 | 2002 | 2005 | 2008 | ||
| Social security, Medicare, and other retirement | 35% | 38% | 37% | 37% | ||
| National defense in 1999 (15%) , veterans benefits and services (2%), and foreign affairs (1%) | 18% | 20% | 24% | 24% | ||
| Social programs: in 1999, 12% for Medicaid, food stamps, temporary assistance for needy families, supplemental security income and related programs and 6% for health research and public health programs, unemployment compensation, assisted housing, and social services | 17% | 21% | 20% | 20% | ||
| Net interest on the debt | 12% | 8% | 7% | 8% | ||
| Physical, human and community development (agriculture, natural resources, environment, transportation, aid to elementary and secondary education and direct assistance to college students, job training, deposit insurance, commerce and housing credits, community development, space, energy, and general science) | 9% | 10% | 10% | 9% | ||
| Surplus to pay down debt | 7% | None | None | None | ||
| Law
enforcement and general government
|
2% |
3% |
2% |
2% |
||
|
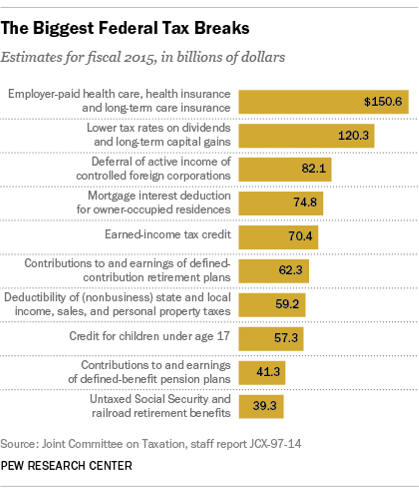
D.
Tax
Expenditures
is a kind of spending in that it is revenue not collected.
|
pewresearch.org/fact-tank/2016/04/06/the-biggest-u-s-tax-breaks/
|
|
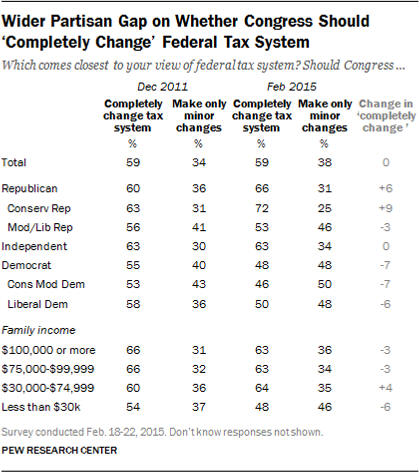
VII. Are Taxes Fair?
People Are Paying
Less
D. Comparing Regressive Payroll Tax US Has Low Safety Net
Follow the Money
|
Partial Reversal of Bush II Tax Cuts 1/2/12 from WSJ
Some Couldn't Afford Safety Net
by 2018 Many
Questioned
Additional Reading:
C. Household Income and Tax Distribution-in 2010 5/12/13 CBO
E. Great Recession Lowers Government Employment
|
|
|
|
|
Calculating 2000 Tax Rates for a Single Filer |
|||
| Taxable Income | Marginal Rate | Bracket Taxes Paid | Average Rate |
| 0 to 26,250 | 15 | .15(26,250) = 3,937.50 | 3,937/26,250 = .150 |
| 26,251 to 63,550 | 28 | .28(63,550-26,250) = 10,444 | (3,937 + 10,444) = 14,381/63,550 = .226 |
| 63,551 to 132,600 | 31 | .31(132,600-63,550) = 21,405 | (14,381+ 21,405) = 35,786/132,600 = .269 |
| 132,601 to 288,350 | 36 | .36(288,350-132,600) = 56,070 | (35,786 + 56,070) = 91856/ 288,350 = .319 |
| 288, 351 and over | 39.6 | ||
|
Calculating 2003 Tax Rates for a Single Filer |
|||
| Taxable Income | Marginal Rate | Bracket Taxes Paid | Average Rate
Calculation Add previous bracket total to bracket this total and divide by bracket upper limit. |
| 0 to 7,000 | 10 | .1(7,000) = 700 | 700/7,000 = .10 is average rate on $7,000. |
| 7,001 to 28,400 | 15 | .15(28,400-7,000) = 3,210 | (700 + 3,210) = 3,910/28,400 = .138 is the average rate on 28,400. |
| 28,401 to 68,800 | 25 | .25(68,800-28,400) = 10,100 | (3,910 + 10,100) = 14,010/68,800 = .204 is the average rate on 68,800. |
| 68,801 to 143,500 | 28 | .28(143,500-68,800) = 20,916 | (14,010 + 20,916 = 34,926/143,500 = .243 is the average rate on 143,500. |
| 143,501 to 311,950 | 33 | .33(311,950-143,500) = 55,589 | (34,926 + 55,589) = 90,515/ 311,950 = .290 is the average rate on 311,950. |
| 311951 and over | 35 |
Economics AP Reviews from amazon.com |
|
| Last Chapter | Next Chapter |
| Chapter 7 Class Discussion Questions | Table of Contents |
| Chapter 7Homework Questions | Economics Internet Library |
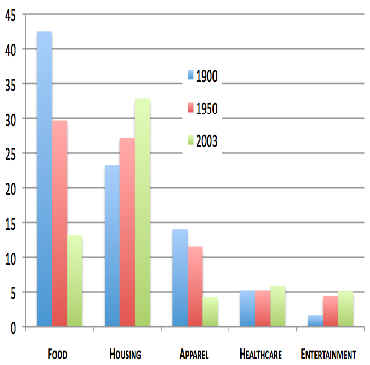
VIII. Visual Learners
|
|
 |
|
|
how-america-spends-money- |
|
|
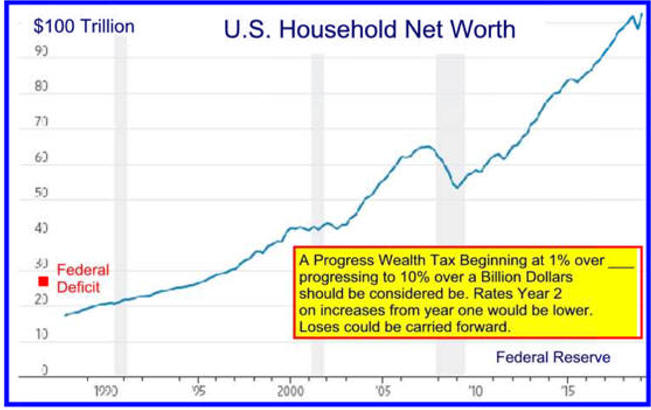
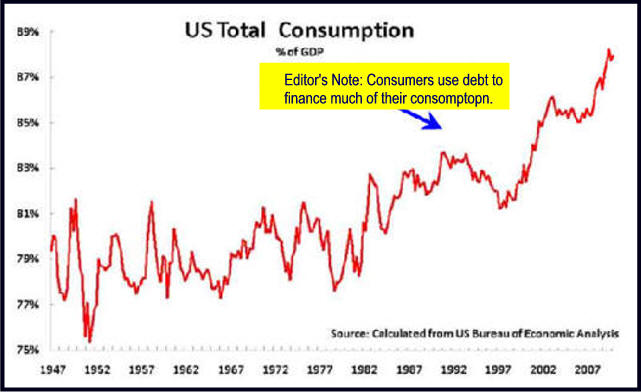
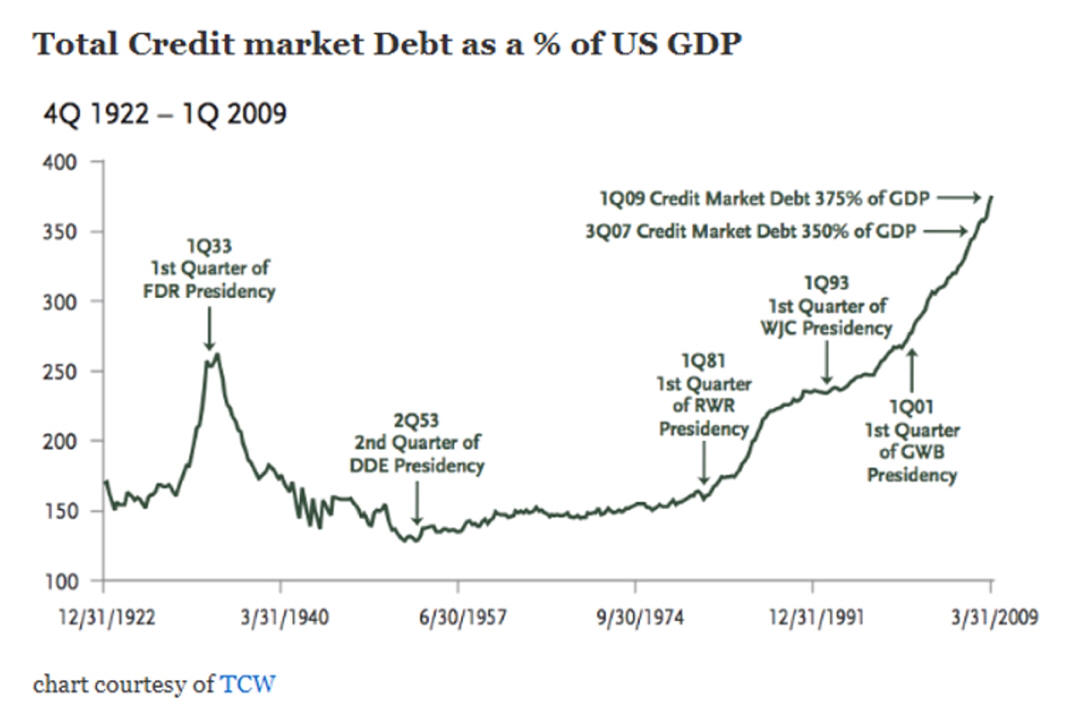
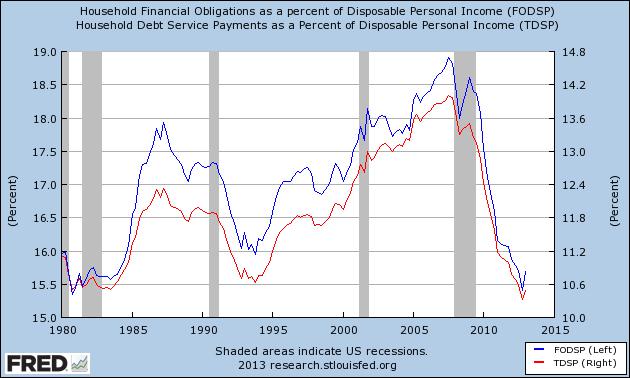
A sea-change in household-deleveraging? 6/9/13
|
|
 |
|
 |
|
|
|
|
|
|
|
b
|
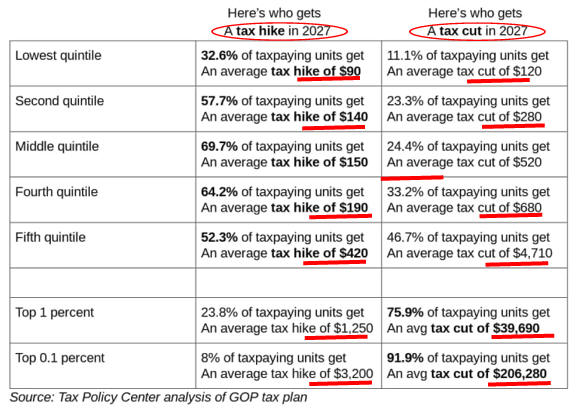
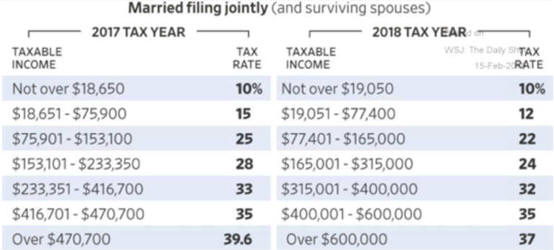
The 2018 Tax Bill
|
|
|
|
The Very High Earners Earn Very, Very, Very Very Much
|
|
|
b
|
The 2018 Tax Bill
|
|
m
|
See |
|
|
|
 |
 |
 |
|
|
|
m
k
As Corporate
Debt Increases,
So Do the Frequency of Financial Crisis
Trump Made Changes
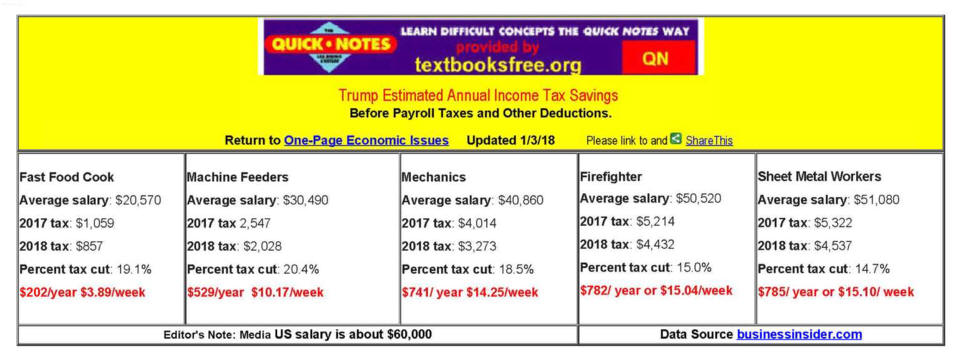
Trump Estimated Income Tax Savings Changes on 10 Years
See Fiscal Math Is Daunting For The Aging Population 4/9/16 Atlanta FED]
m
 |
Analysis: One of the weaknesses of National Income Accounting, covered in the next chapter, is it doesn't measure everything. Here, we see negative saving because expenditures from the underground economy have been included but income has not been included as people illegally avoid taxes. Also, expenditures on home improvements count, but gains when the home is sold are not personal income
but capital gains. SS and Medicare tax rates go up continually and aren't help when people get older and aren't savings. Economic Well Being of U.S.-2014 Households FED survey |
Tax Expenditures Helps Many
To get revenue loss from tax
expenditures
|
|
|
|

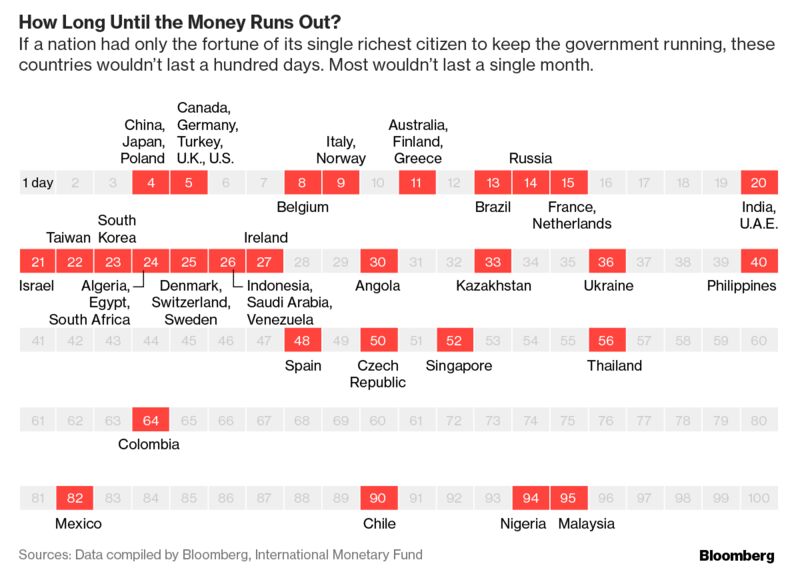
What If-the World's Richest Paid For Government Spending


