|
|
|
Index |

|
Lecture Notes
I. The
marketplace
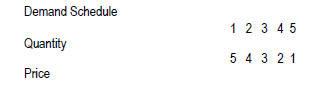
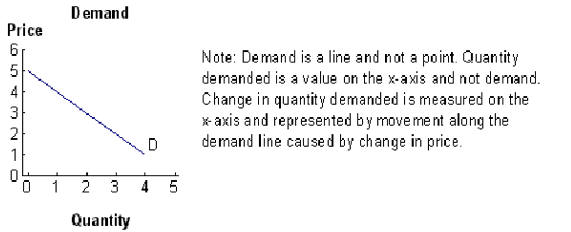
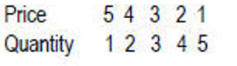
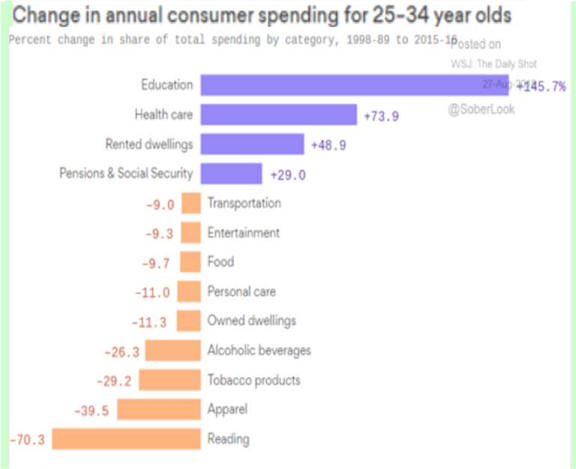
A. Demand is a schedule of the
amounts of goods and services consumers
 Note: Increase is to the right because the x-axis increases to the right. H. Explorations
in Economic Demand by Kim Sosin,
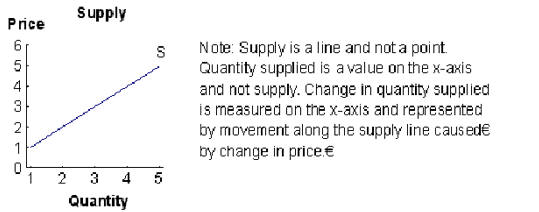
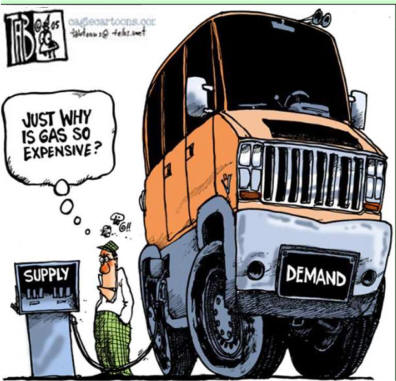
III. Supply is willingness to sell
D.
What determines supply IV.
Equilibrium is where suppliers and demanders agree
on price
F. Post WW2 Equilibrium
V. Government
imposed price ceilings and floors
|
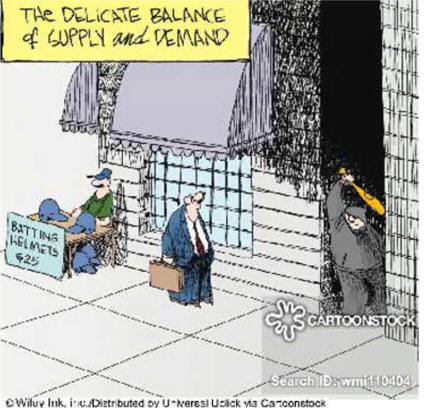
Supplemental
Political Cartoons Analyze
The Free Market Does Work: How Pot Legalization
Preface:
Do Economists Lie? 3. Inflation's Back, Trouble Ahead?
5.
Recession Coming?
4. Dollar Privilege Continuation
5. Disposition-Illegal Immigrants
6. Is Income Inequality Affecting Growth
7. Will Stagnate Income Continue
8. Russia/China U.S. Adversaries
|


|
VI. Changes in supply and demand affect equilibrium
A. Econ Concepts in 60 Second Video on Double Shifts in Supply and Demand B Econ Concepts in 60 Seconds Video on Shifting Supply and Demand C. Another View |
|||
|
D up and S up equally D up causes
|
D up and S D up causes
S down causes Result is P up and Q same
|
|
|
|
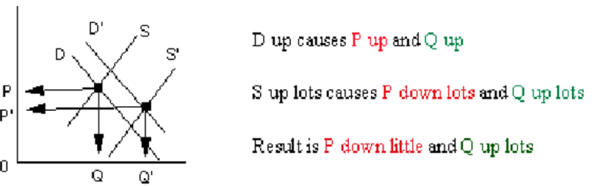
D down and S up equally D down causes P down and Q down S up causes P down and Q up Result is P down and Q same |
D down and S down equally D down causes P down and Q down S down causes |
|
|
D.
View a dynamic model of
Changes in
Supply, Demand and Market Equilibrium E. Unequal Shifts in Demand and Supply
|
|||
|
D up and S up
more |
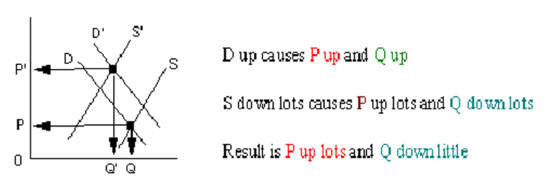
D up and S down more
|
||
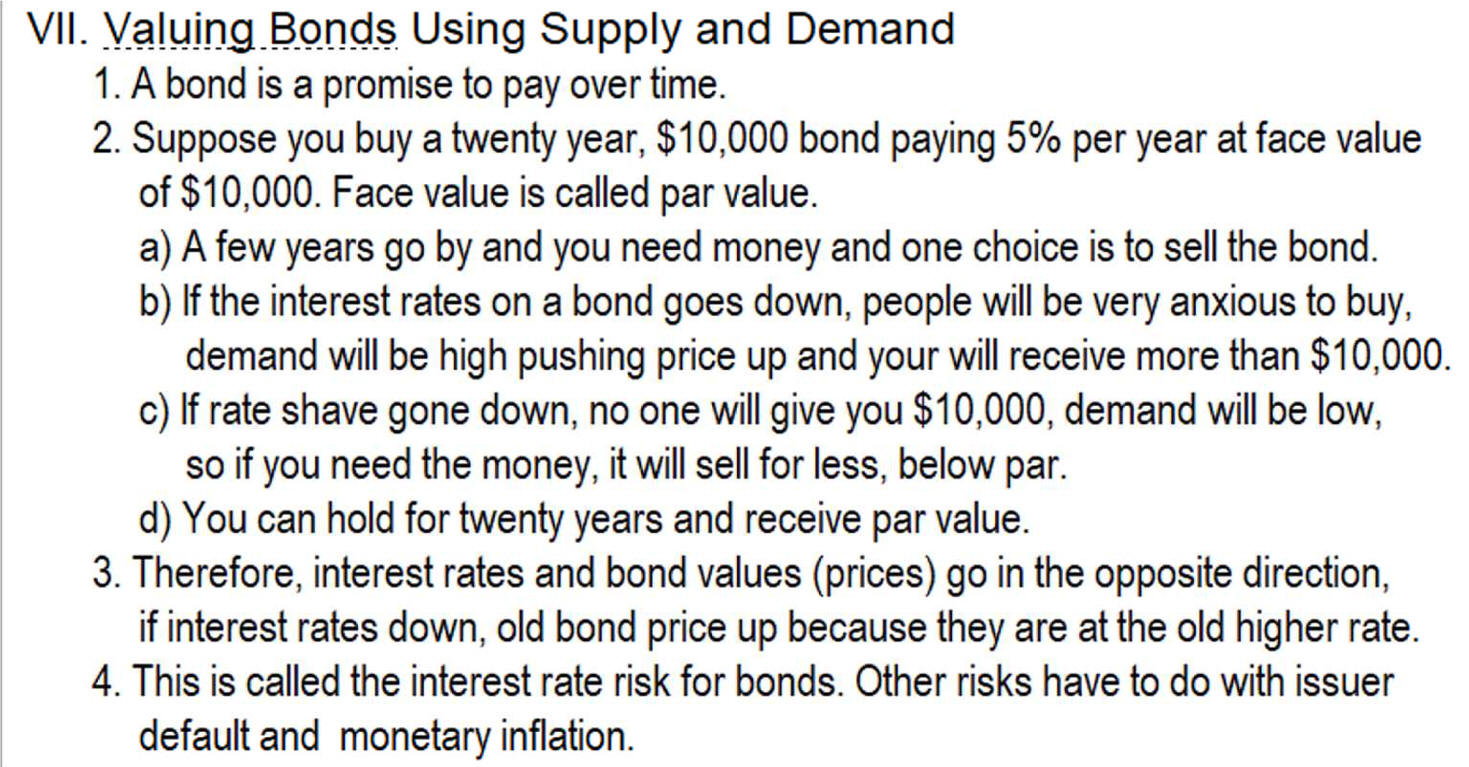
5.
Market Value of Issued
Bond Kahn
Video from Khan Academy |
|
|
Supplemental Political Economy Stuff
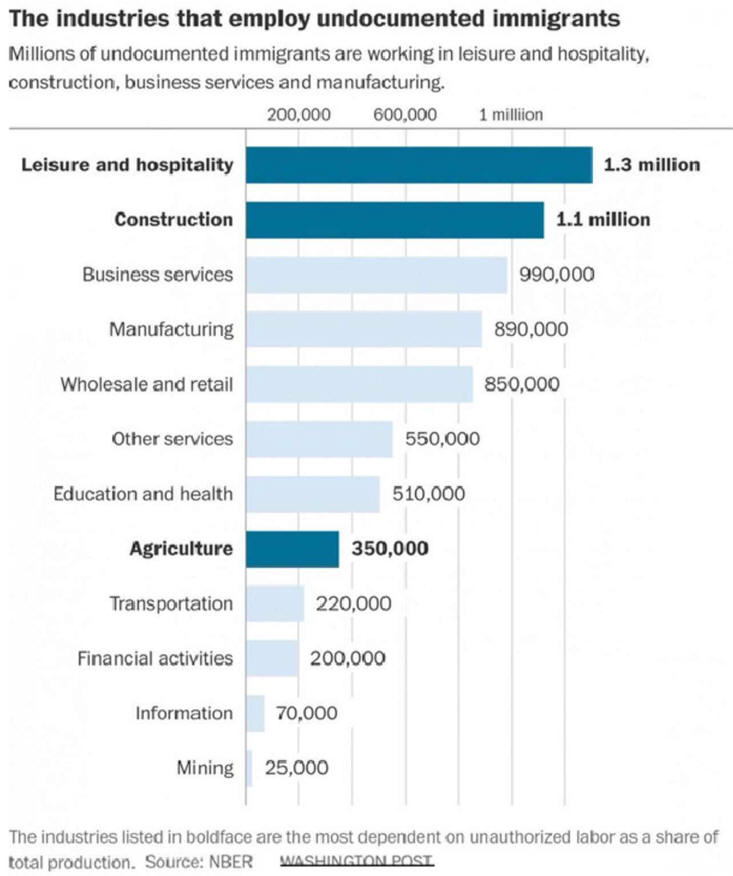
VIII. Would deportation of illegal immigrants
|
| Last Chapter |
| Chapter 4 Class Discussion Questions |
| Chapter 4 Homework Questions |
| Next Chapter |
| Table of Contents |
| Economics Internet Library |