|
|
Overview
On a standard
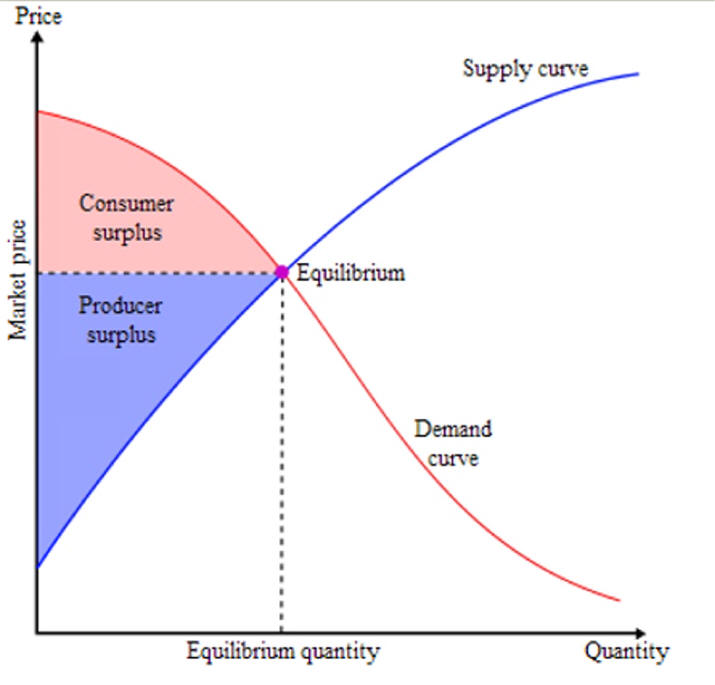
supply and demand (S&D) diagram, consumer surplus (CS) is the
triangular area above the price level and below the demand curve,
since intramarginal consumers are paying less for the item than the
maximum that they would pay. In contrary, producer surplus (PS) is
the triangular area below the price level and above the supply
curve, since that is the minimum quantity a producer can produce.
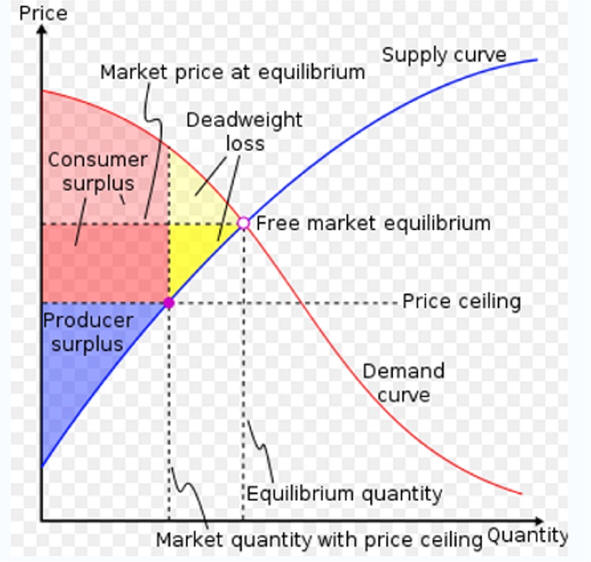
If the
government intervenes by implementing, for example, a
tax or a
subsidy, then the graph of supply and demand becomes more
complicated and will also include
an area that represents
government surplus.
Combined, the consumer surplus, the producer surplus, and the
government surplus (if present) make up the social surplus or
the total surplus. Total surplus is the primary measure used
in
welfare economics to evaluate the efficiency of a proposed
policy.
A basic technique of
bargaining for both parties is to pretend that their surplus is
less than it really is: sellers may argue that the price they ask
hardly leaves them any profit, while customers may play down how
eager they are to have the article.
In
national accounts,
operating surplus is roughly equal to distributed and
undistributed pre-tax
profit income, net of depreciation.
In some schools of
heterodox economics, the economic surplus denotes the total
income which the
ruling class derives from its ownership of scarce
factors of production,
which is either reinvested or spent on
consumption.
In
Marxian economics, the term surplus may also refer to
surplus value,
surplus product and
surplus labor.
Consumer surplus
The individual consumer surplus is the difference between the
maximum total price a consumer would be willing to pay (or
reservation price) for the amount he buys and
the actual total
price.
If someone is willing to pay more than the actual price, their
benefit in a transaction is how much they saved when they didn't pay
that price. For example, a person is willing to pay a tremendous
amount for water since he needs it to survive, however since there
are competing suppliers of water he is able to
purchase it for less
than he is willing to pay. The difference between the two prices is
the consumer surplus.
The maximum price a consumer would be willing to pay for a given
amount is the sum of the maximum price he would be willing to pay
for the first unit, the maximum
additional price he would be willing
to pay for the second unit, etc. Typically these prices are
decreasing; in that case they are given by the individual
demand curve. If these prices are first increasing and then
decreasing there may be a non-zero amount with zero consumer
surplus. The consumer would not buy an amount larger
than zero and
smaller than this amount because the consumer surplus would be
negative. The maximum additional price a consumer would be willing
to pay for each additional unit may also alternating be high and
low, e.g. if he wants an even number of units, such as in the case
of tickets he uses in pairs on dates. The lower values
do not show
up in the demand curve because they correspond to amounts the
consumer does not buy, regardless of the price. For a given price
the consumer buys the amount for which the consumer surplus is
highest.
One
bargaining tactic is to pretend a lower consumer surplus. The aggregate consumers' surplus is the sum of the consumer's
surplus for each individual consumer. This can be represented on the
figure of the aggregate demand curve.
1.
Friedman,
David D
Price Theory: An Intermediate Text - Chapter 9 and
2. Further Reading
Henry George,
Progress and Poverty
[1]
|
|
Calculation from supply and demand
The consumer surplus (individual or aggregated) is the area under
the (individual or aggregated) demand curve and above a horizontal
line at the actual price (in the aggregated case: the equilibrium
price). If the demand curve is a straight line, the consumer surplus
is the area of a triangle:
-
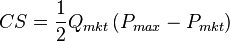
Where Pmkt is the equilibrium price (where supply
equals demand), Qmkt is the total quantity purchased at
the equilibrium price and Pmax is the price at which the quantity purchased would fall to 0 (that is, where the demand curve
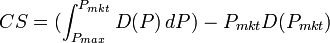
intercepts the price axis). For more general demand and supply
functions, these areas are not triangles but can still be found
using
integral calculus. Consumer surplus is thus the definite
integral of the demand function with respect to price, minus the
definite integral of the constant function D(P)=Qmkt
(i.e. PmktQmkt), from the market price to the
maximum reservation price (i.e. the price-intercept of the demand
function):
-
The graph shows, that if we see a rise in the equilibrium price
and a fall in the equilibrium quantity, then consumer surplus falls.
Distribution of benefits when price falls
When supply of a good expands, the price falls (assuming the
demand curve is downward sloping) and consumer surplus increases.
This benefits two groups of people.
Consumers who were already
willing to buy at the initial price benefit from a price reduction;
also they may buy more and receive even more than at the initial price and also receive some consumer
surplus.
Consider an example of linear supply and demand curves. For an
initial supply curve S0, consumer surplus is the triangle
above the line formed by price P0 to the demand line
(bounded on the left by the price axis and on the top by the demand
line). If supply expands from S0 to S1, the
consumers' surplus expands to the triangle above P1 and
below the demand line (still bounded by the price axis). The change
in consumer's surplus is difference in area between the two
triangles,
and that is the consumer welfare associated with
expansion of supply.
Some people were willing to pay the , the by P1,
on the left by the price axis and on the right by line extending
vertically upwards from Q0.
The second set of beneficiaries are consumers who buy more, and
new consumers, those who will pay the new lower price (P1)
but not the higher price (P0).
Their additional
consumption makes up the difference between Q1 and Q0.
Their consumer surplus is the triangle bounded on the left by the
line extending vertically upwards from Q0, on the right
and top by the demand line, and on the bottom by the line extending
horizontally to the right from P1.
Rule of one-half
The rule of one-half estimates the change in surplus for
small changes in supply with a constant demand curve. Note that in
this special case where the consumer
demand curve is linear,
consumer surplus is the area of a triangle. Following the figure
above,
-

where:
- CS = Consumers' Surplus
- Q0 and Q1 are the quantity demanded
before and after a change in supply
- P0 and P1
are the prices before and after a change in supply
|


 f
f
