|
V.
Should the
Federal Debt be Paid
Prelude:
National Debt
Basics Video 15 min
A. Pay it
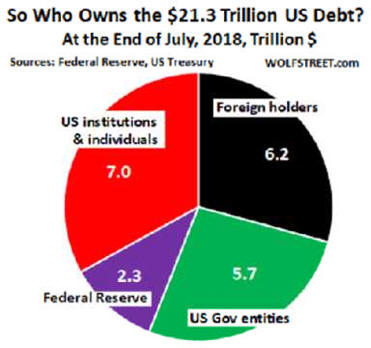
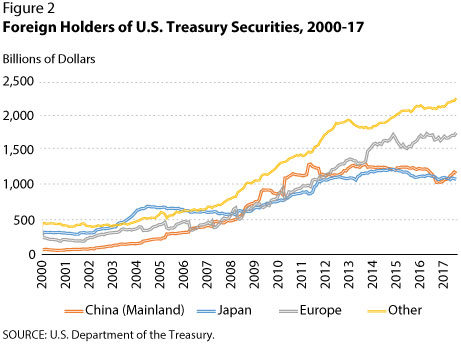
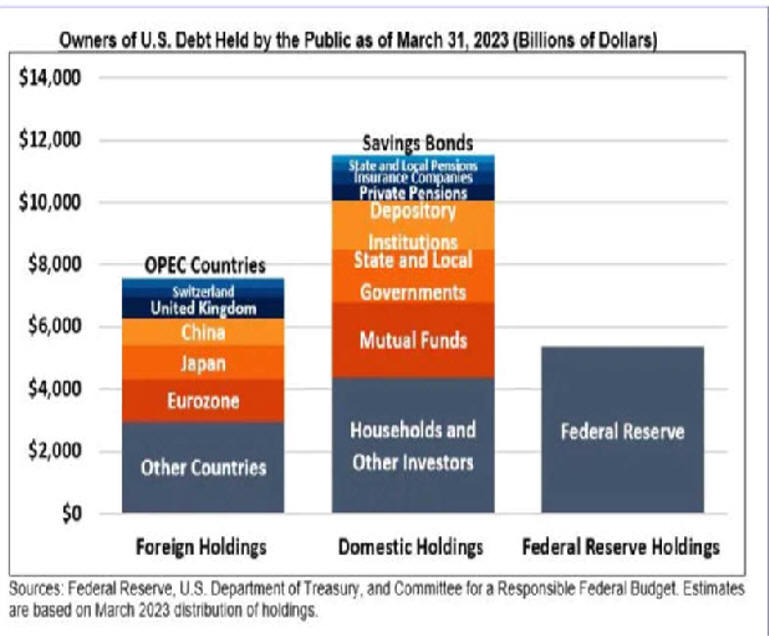
1. The external
debt (owned by foreigners) has gone up from
5% in 1960 to 13% in 1988, 22% in 1999 and 43% in 2005.
2. The
crowding-out effect slows growth as Federal dissaving
causes
high interest rates lowering private investment.
3. Paying $230
billion in annual interest causes incentive problems
as this money
could be used
to solve many problems.
4. Recently
foreigners have been willing to invest their export earnings in America
helping
to minimize the effect of the high federal deficits on interest rates.
a. If
foreigners decided not to make these investments, interest
rates would increase, slowing economic growth.
b.
Interestingly one of the reasons the Federal Reserve
was unable to lower long
interest rates quickly during the 1990-91 recession and its recovery may have
been
the Japanese decision to dramatically curtail their U.S. investments.
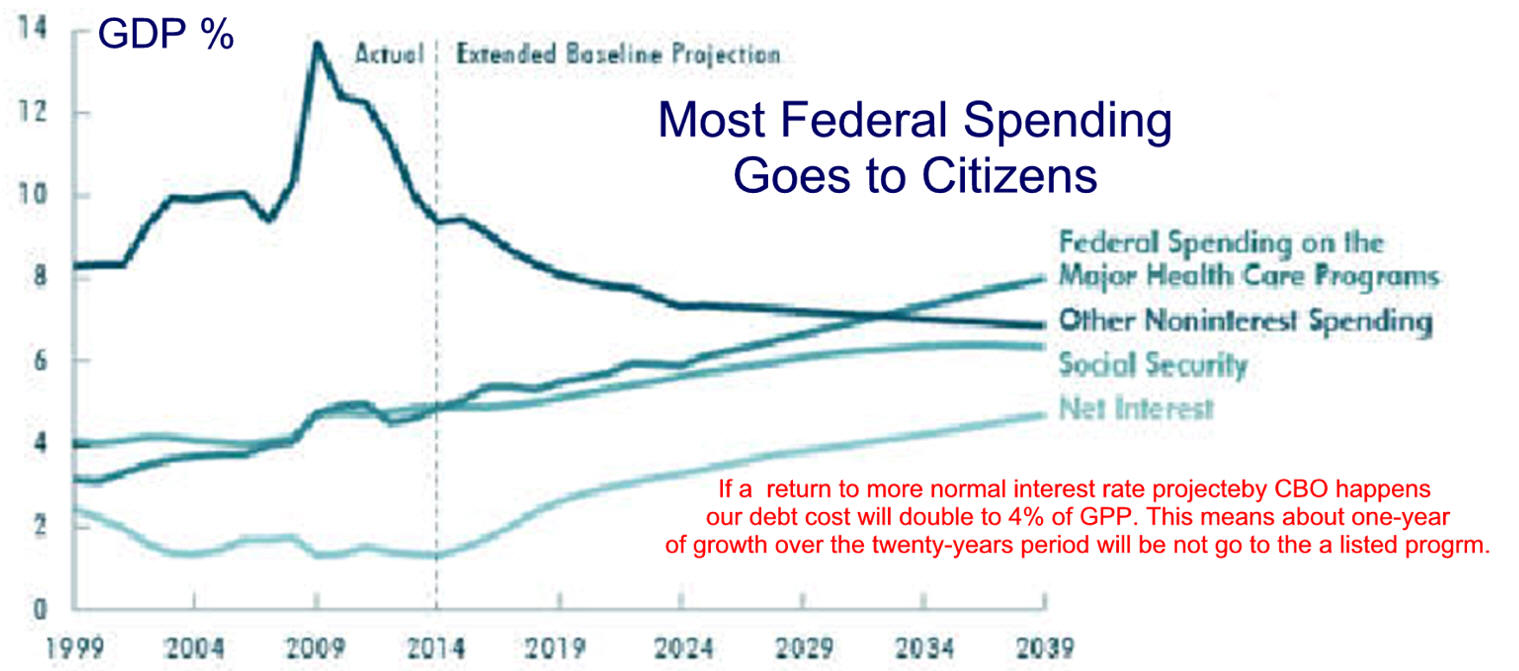
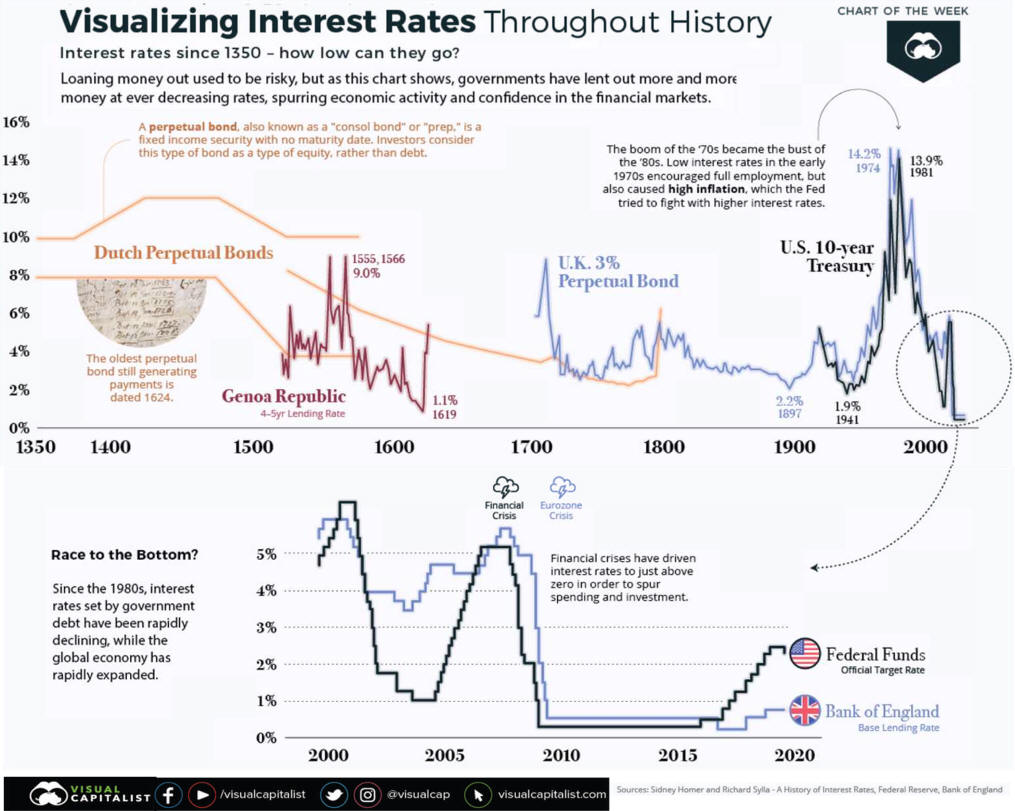
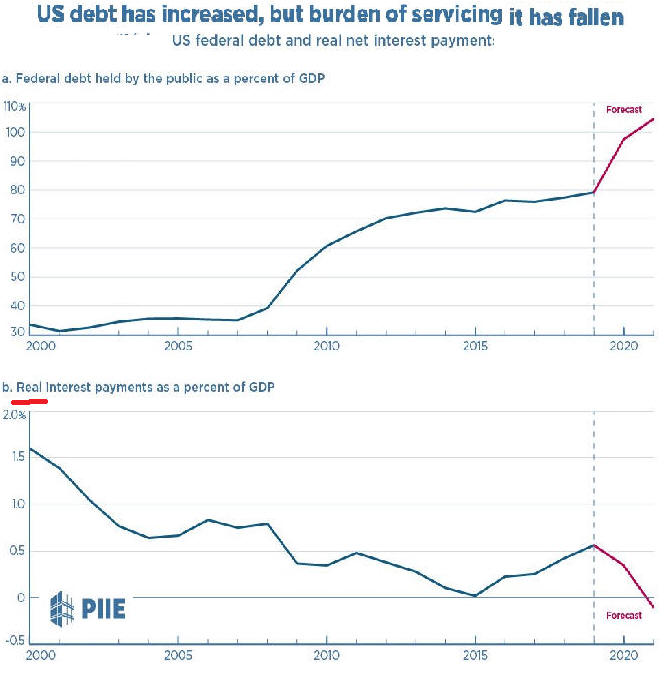
5. Annual interest on the federal
debt increased 50% (from
1.9% to 3.3%) during the 1980's. By 1999 it was down to 2.5%.
6.
How To Tell
Debt Facts From Political Hype
7.
Good Is Bad Up Is Down
B. Don't Pay It
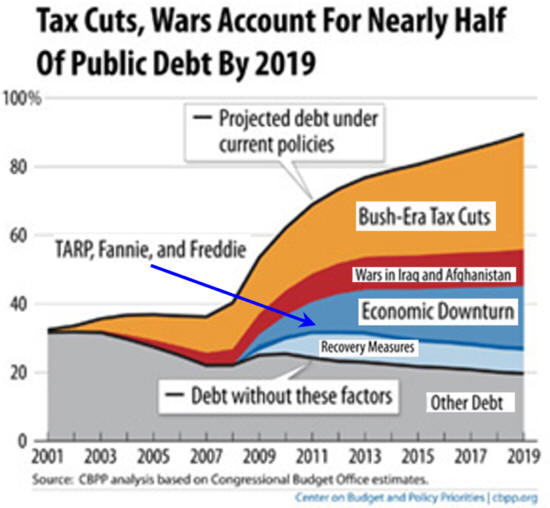
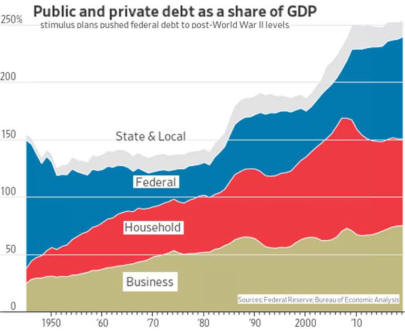
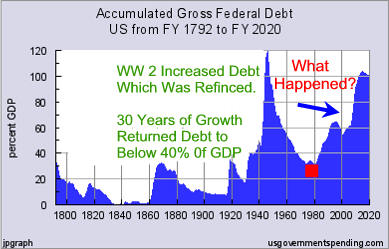
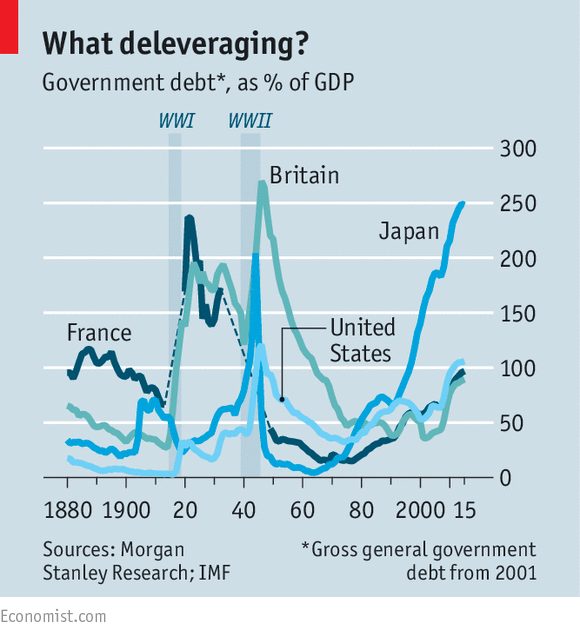
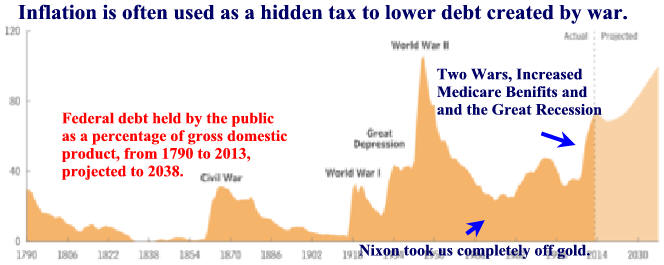
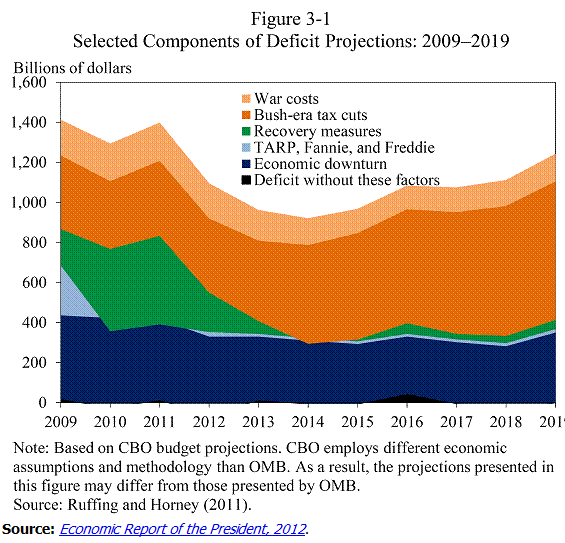
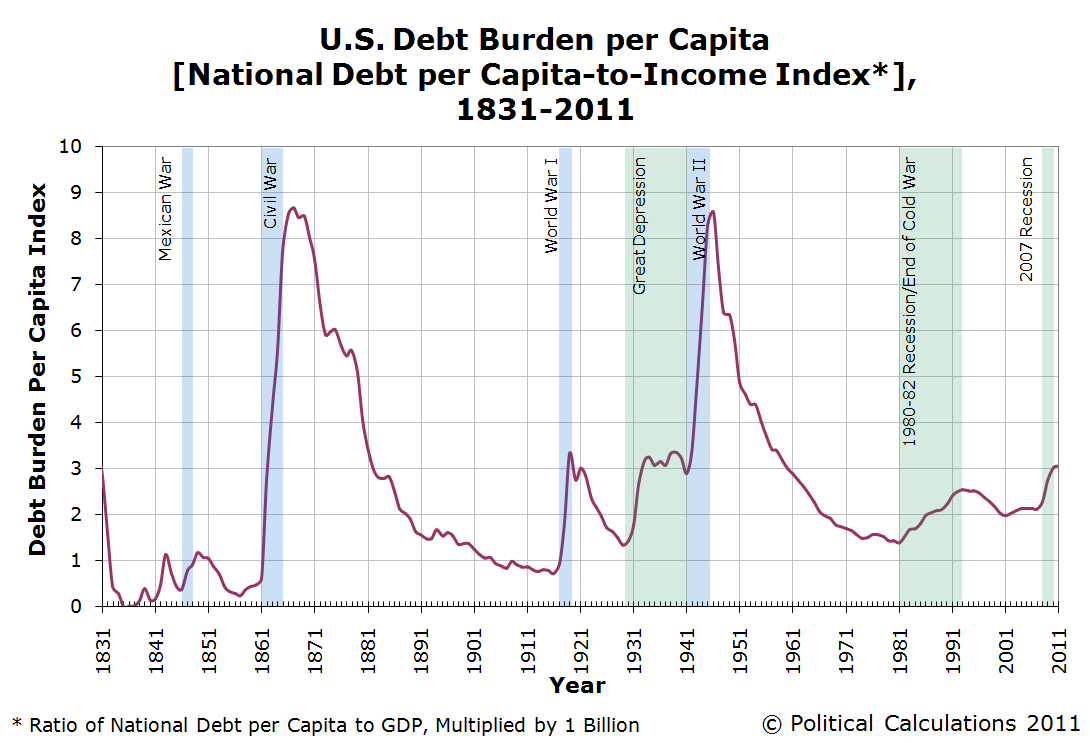
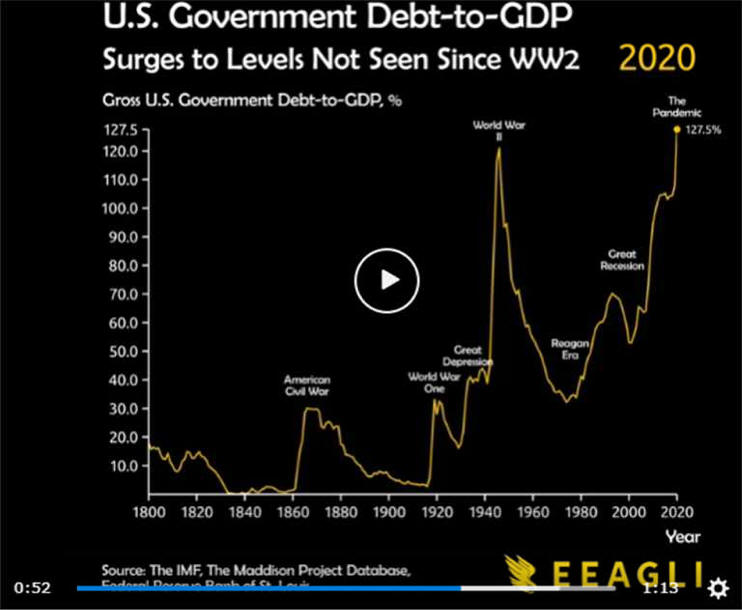
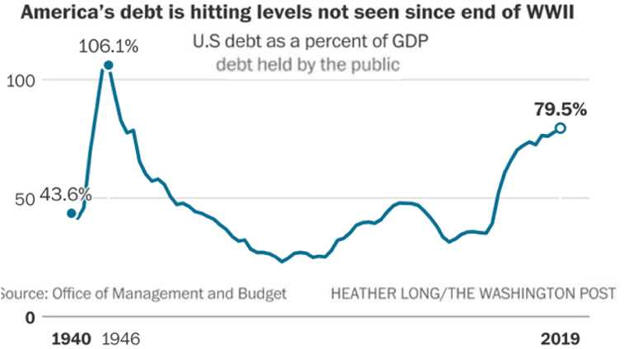
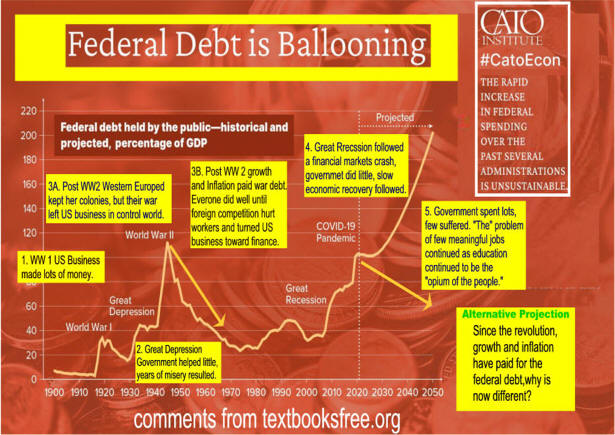
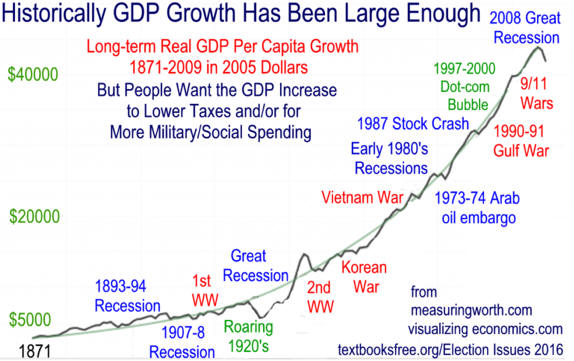
1. The debt was caused by wars and recessions.
2. We are not going
bankrupt, the debt is about 100 % of
one year's GDP.
a.
First-time homeowners go a few salary
years into debt.
b.
Much of the annual deficit goes into
capital expenditures and because the
U.S.
does not have a capital budget, these items are all expensed in
the year
of purchase.
During periods of growth, the result is
an over statement
of the
deficit.
3. Paying it would overtax
the average American.
4. Most Americans would
rather spend tax
money to solve problems
rather than
lower the deficit.
a. This attitude changed
substantially in the
early
1990's.
b. By the end of the
1990's, projection had
the debt paid off in 10 years.
By 11/01
the
impending recession and events of
September 11
cast a shadow
on this 10-year projection
4.
What
is the Federal Debt: a primer for politicians
5.
The Big Lie
6.
2 Concerns: U. S. Governments Debt
7.
Deflating National Debt Through Inflation
5 min video
8.
Ray-of-hope-about-the-federal-deficit/
C.
Balance the budget is a simulation that
allows
participants to make changes and balance the budget.
D.
Modern Money & Public Purpose 1 hour
plus
1, The Historical Evolution of Money and Debt
2. Governments Are Not Households
3: The Eurozone
4: Real vs. Nominal Economy
|
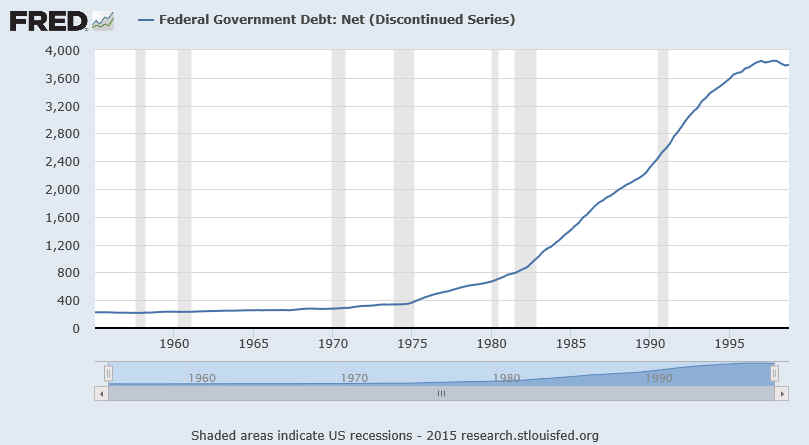
Who Has Paid For the
Federal Debt?
End of
Fiscal Year |
US Gross Debt
in Nominal USD billions |
US Gross Debt
as % of GDP |
Who Paid |
| 1940 |
43.0 |
52.4 |
No
One |
| 1950 |
257.4 |
94.1 |
| 1960 |
290.2 |
56.1 |
| 1970 |
389.2 |
37.6 |
| 1980 |
930.2 |
33.3 |
No
One |
| 1990 |
3,233 |
55.9 |
| 2000 |
5,674 |
58 |
TBD |
| 2005 |
7,933 |
64.6 |
| 2007 |
9,008 |
65.5 |
| 2008 |
10,699.8 |
74.6
(EST) |
|
2009 |
11,046.2 |
|
TBD |
|
United
States public debt - Wikipedia, the free encyclopedia |
What if the Federal Budget Was $100
Navigating Big Debt Crises
Mark Blyth Videos
Devastates Approach to Budget
Liberal View of Balanced
Budgets
Interest Payment Management Approach
Please link to and Share!
10/2/22
See
Quick Economics
Notes
|
|
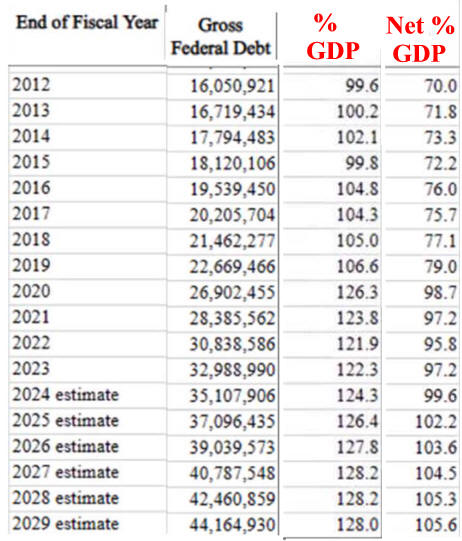
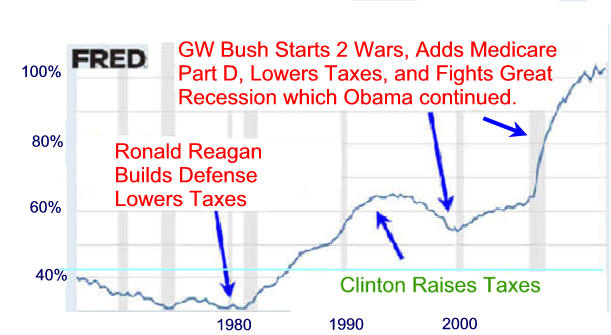
Editor's Note:
The Debt to GDP
ration headed up
with Ronald Reagan, dropped with
Clinton, then headed up again with
Bush 2 and finally leveled off killing Obama's second term projections could force reductions
in entitlements unless the economy really takes off.
The effect of Obamacare are not known. Entitlements
are not contracts. What
congress gives it can
take away.
|